Note
Go to the end to download the full example code.
Plot maps#
The imod.visualize.plot_map functionality of iMOD Python allows to create
customized plots.
Import the necessary packages:
import numpy as np

import imod
Import the input data to plot:
tempdir = imod.util.temporary_directory()

lakes = imod.data.lakes_shp(tempdir)
surface_level = imod.data.ahn()["ahn"]
It is necessary to define the Matplotlib colorbar to be used and the levels for the legend as a list.
colors = "RdYlBu_r"
levels = np.arange(-15, 17.5, 2.5)
The next lines show the simplest way to plot the raster.
imod.visualize.plot_map(surface_level, colors, levels)
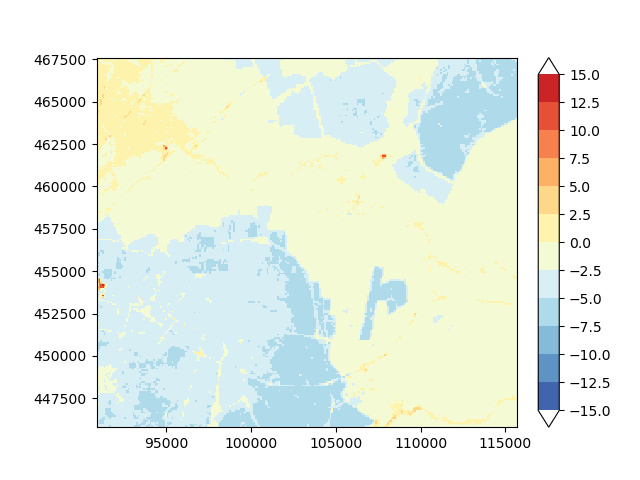
(<Figure size 640x480 with 2 Axes>, <Axes: >)
It is also possible to add an overlay to the previous map
overlays = [{"gdf": lakes, "facecolor": "black", "alpha": 0.3}]

imod.visualize.plot_map(surface_level, colors, levels, overlays=overlays)
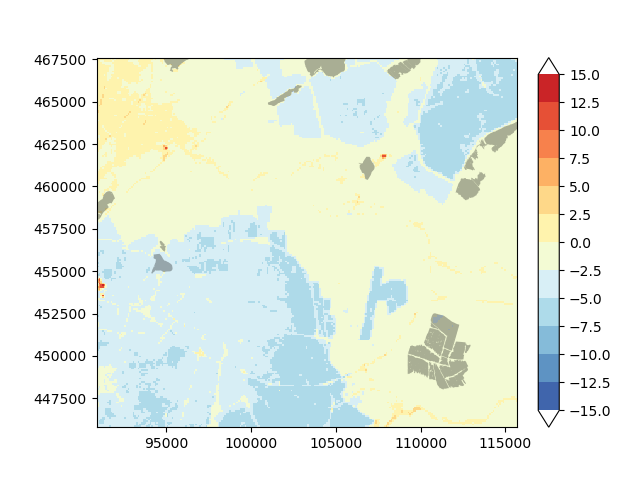
(<Figure size 640x480 with 2 Axes>, <Axes: >)
Label the colorbar as follows:
imod.visualize.plot_map(
    surface_level, colors, levels, kwargs_colorbar={"label": "Surface level (m)"}
)
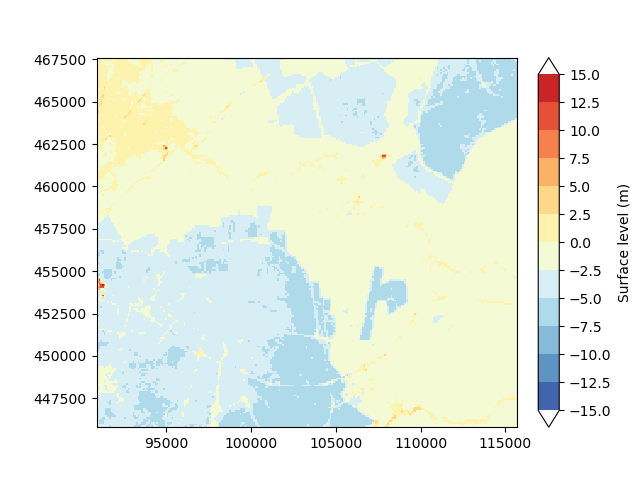
(<Figure size 640x480 with 2 Axes>, <Axes: >)
And to include a basemap:
import contextily as ctx

src = ctx.providers.OpenStreetMap.Mapnik
imod.visualize.plot_map(
    surface_level,
    colors,
    levels,
    basemap=src,
    kwargs_basemap={"alpha": 0.6},
    overlays=overlays,
    kwargs_colorbar={"label": "Surface level (m)"},
)
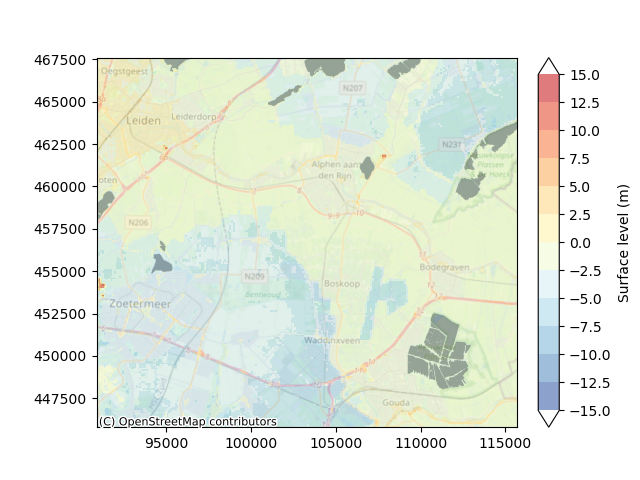
(<Figure size 640x480 with 2 Axes>, <Axes: >)
Total running time of the script: (0 minutes 1.969 seconds)