Note
Go to the end to download the full example code.
Reproject data#
In this example we will see how to reproject vector and raster datasets.
import matplotlib.pyplot as plt
import pyproj
We’ll start with the imports
import imod
Reproject points#
wgs84 = pyproj.CRS("EPSG:4326")
amersfoort = pyproj.CRS("EPSG:28992")
lon = [5.053, 4.479, 5.722]
lat = [52.201, 52.009, 52.19246]
x, y = pyproj.transform(wgs84, amersfoort, lat, lon)

print(x, y)
[132152.59039576206, 92645.5317909315, 177892.3125604112] [468151.410998257, 447126.74989173946, 467201.53865388624]
Reproject vector dataset#
In this case, the shapefile is imported using geopandas, obtaining a GeoDataFrame. GeoPandas has the option geopandas.GeoSeries.to_crs to directly change the coordinate system of a geopandas GeoDataFrame.
temp_dir = imod.util.temporary_directory()

lakes = imod.data.lakes_shp(temp_dir)
print(lakes.crs)

lakes_wgs84 = lakes.to_crs(epsg=4326)
print(lakes_wgs84.crs)
EPSG:28992
EPSG:4326
Reproject raster dataset#
imod-python has the function imod.prepare.reproject(). There are
three options:
1. Resample to a new cellsize#
Use the same projection: provide only “like”.
Importing the original file, which has a cellsize of 100.0 m and its EPSG is 28992:
ahn = imod.data.ahn()["ahn"]

fig, ax = plt.subplots()
ahn.plot.imshow(ax=ax)
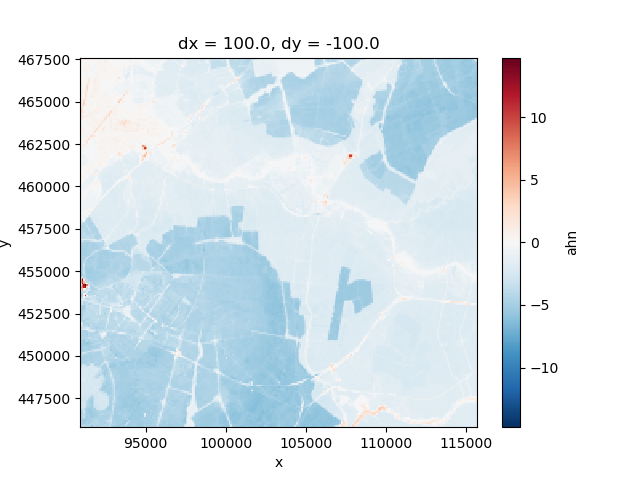
<matplotlib.image.AxesImage object at 0x0000019B2F20B9B0>
We’ll create our like grid Resampling DataArray to a new cellsize of 50.0 m, by creating a like DataArray first:
xmin = 90950
xmax = 115650
ymax = 467550
ymin = 445850
cellsize = 50.0
dx = cellsize
dy = -cellsize

like = imod.util.empty_2d(dx, xmin, xmax, dy, ymin, ymax)
Apply the imod.prepare.reproject() function. The new dataset will
have a 50 m resolution:
ahn_50m = imod.prepare.reproject(source=ahn, like=like, method="average")
print(ahn_50m.res)
(50.0, 50.0)
2. Only reproject#
Only provide the source coordinate reference system (src_crs) and the target coordinate reference system (dst_crs). In this case, to reproject from EPSG:28992 to EPSG:32631:
ahn_utm = imod.prepare.reproject(source=ahn, src_crs="EPSG:28992", dst_crs="EPSG:32631")
print(ahn_utm.res)
(99.98263748545648, 99.98263748545648)
If we plot, notice that the grid is slightly “rotated”. This is caused by the reprojection.
fig, ax = plt.subplots()
ahn_utm.plot.imshow(ax=ax)
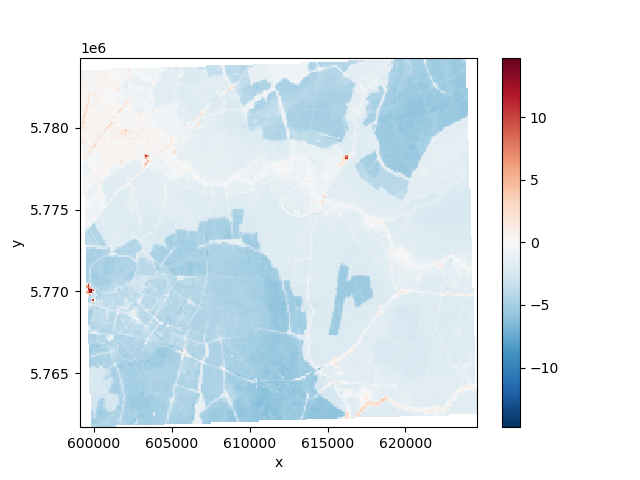
<matplotlib.image.AxesImage object at 0x0000019B180BF440>
3. Reproject and resample to a specific domain#
Provide “src_crs”, “dst_crs” and “like”. The resulting dataset will have a cellsize of 50m and it’s coordinate system will be EPSG:32631:
ahn_utm_50m = imod.prepare.reproject(
    source=ahn, like=like, src_crs="EPSG:28992", dst_crs="EPSG:32631"
)
print(ahn_utm_50m.res)
print(ahn_utm_50m.crs)
(50.0, 50.0)
EPSG:32631
Total running time of the script: (0 minutes 0.844 seconds)