Note
Go to the end to download the full example code.
Head point interpolation#
The starting heads to be used for a model could be based on the interpolation of x-y head measurements.
TIP: In order to have better interpolation results, an area larger than the model domain should be considered.
import matplotlib.pyplot as plt
We’ll start with the usual imports
import numpy as np

import imod
Head measurements information has been obtained from the Dinoloket website for the case study area. This data consists on a .csv file (read using Pandas pd.read_csv ) that contains the following columns: id, time, head, filt_top, filt_bot, elevation, x and y. For this example, all the measurements at different depths and along time for a same id were averaged, to have one reference head value in each point.
heads = imod.data.head_observations()

mean_heads = heads.groupby("id").mean()  # Calculating mean values by id

mean_heads.head(5)
Next we’ll require a grid to interpolate on. iMOD Python has some useful utility functions to generate an empty grid.
xmin = 225_500.0
xmax = 240_000.0
ymin = 559_000.0
ymax = 564_000.0
dx = 100
dy = -100

grid = imod.util.empty_2d(dx, xmin, xmax, dy, ymin, ymax)
Before we can select points in a grid, we first have to remove the points outside the domain.
points_outside_grid = (
    (mean_heads["x"] < xmin)
    | (mean_heads["x"] > xmax)
    | (mean_heads["y"] < ymin)
    | (mean_heads["y"] > ymax)
)
mean_heads_in_grid = mean_heads.loc[~points_outside_grid]

mean_heads_in_grid.head(5)
The previous head information needs to be assigned to the model grid. imod-python has a tool called imod.select.points_set_values, which assigns values based on x-y coordinates to a previously defined array. In this case, the array is the starting_heads_larger, the values are the mean calculated heads and the x and y are the coordinates corresponding to the heads.
x = mean_heads_in_grid["x"]
y = mean_heads_in_grid["y"]

heads_grid = imod.select.points_set_values(
    grid,
    values=mean_heads_in_grid["head"].to_list(),
    x=x.to_list(),
    y=y.to_list(),
)

# Plotting the points
fig, ax = plt.subplots()
heads_grid.plot.imshow(ax=ax)
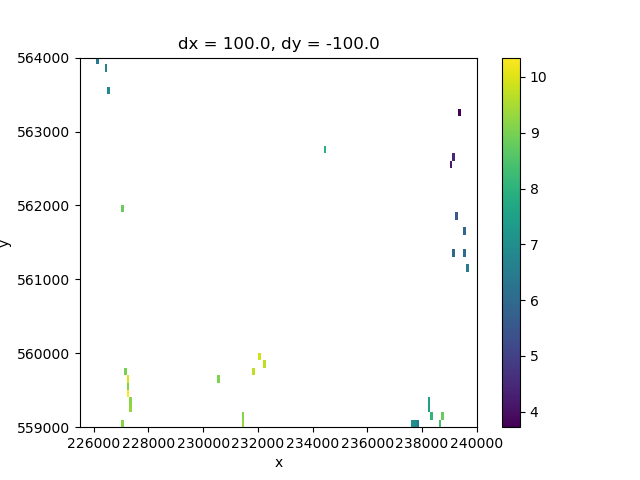
<matplotlib.image.AxesImage object at 0x0000019B383F78C0>
The previous information is still only available at certain points, so it needs to be interpolated. The iMOD Python tool imod.prepare.laplace_interpolate will be used to do an interpolation of the previously indicated head values. It is possible to assign interpolation parameters such as the number of iterations and the closing criteria.
interpolated_heads = imod.prepare.laplace_interpolate(
    heads_grid, atol=0.001, maxiter=150
)

# Plotting the interpolation results
fig, ax = plt.subplots()
interpolated_heads.plot.imshow(ax=ax)
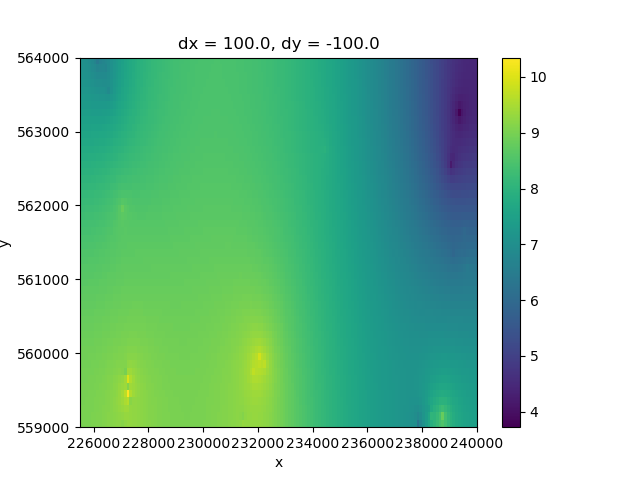
<matplotlib.image.AxesImage object at 0x0000019B35A031D0>
It might be nice to have the locations of the boreholes plotted together with the interpolation, so that we can better judge the quality of the interpolation.
We can use the plt.scatter function to plot the borehole locations on top.
# Derive grid with which cell has an observation
is_observation = (~np.isnan(heads_grid)).astype(np.float64)

fig, ax = plt.subplots()
# Plot the interpolation results
interpolated_heads.plot.imshow(ax=ax)

# Plot the borehole locations on top
plt.scatter(x=mean_heads_in_grid["x"], y=mean_heads_in_grid["y"], color="black", s=5)
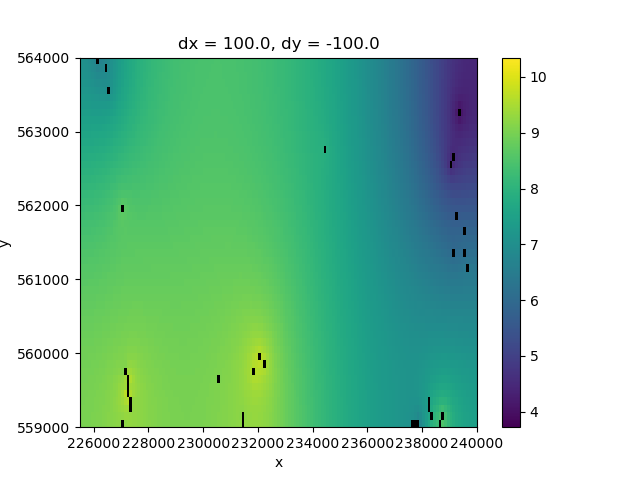
<matplotlib.collections.PathCollection object at 0x0000019B3598C110>
Total running time of the script: (0 minutes 2.188 seconds)