Note
Go to the end to download the full example code.
HyDAMO Network#
This is small dataset containing elevation points, cross-section profiles and center lines for a small stream network.
It is simplified HyDAMO data, the standardized data model for surface water in the Netherlands.
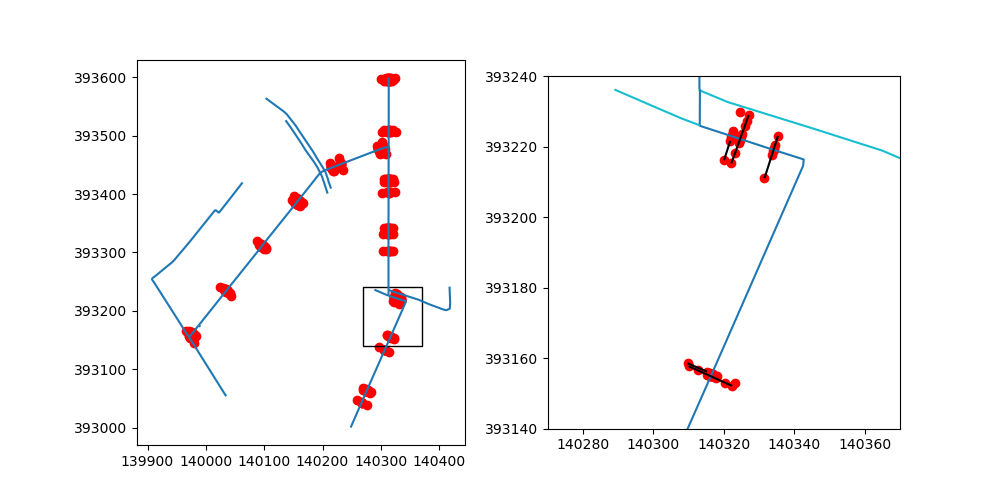
(393140.0, 393240.0)
import matplotlib.patches as patches
import matplotlib.pyplot as plt

import xugrid

lines, profiles, points = xugrid.data.hydamo_network()

xy = (140_270.0, 393_140.0)
dx = dy = 100.0

fig, (ax0, ax1) = plt.subplots(ncols=2, figsize=(10, 5))
lines.plot(ax=ax0)
profiles.plot(ax=ax0, color="red")
ax0.add_patch(patches.Rectangle(xy, dx, dy, fill=False))

lines.plot(ax=ax1, column="type")
profiles.plot(ax=ax1, color="red")
points.plot(ax=ax1, color="black")
ax1.set_xlim(xy[0], xy[0] + dx)
ax1.set_ylim(xy[1], xy[1] + dy)
Total running time of the script: (0 minutes 0.338 seconds)