Note
Go to the end to download the full example code.
Gridding Ugrid1d Network Data to 2D Grids#
In this example, we demonstrate how to interpolate and grid data from a network of line elements (UGRID1D) to a 2D structured grid. We’ll cover the following xugrid techniques:
Creating Ugrid1d networks from node and edge arrays
Finding intersections between 1D and 2D grid edges
Refining networks by inserting intersection points
Topology-aware Laplace interpolation along networks
Converting node data to edge data
Regridding from 1D networks to 2D grids using NetworkGridder
Visualization of mixed 1D and 2D grids
We’ll start by setting up the structured grid first and converting it to a Ugrid2d grid.
import numpy as np
import xarray as xr

import xugrid as xu


def make_structured_grid(nrow, ncol, dx, dy):
    if dy >= 0:
        raise ValueError("dy must be negative.")

    shape = nrow, ncol

    xmin = 0.0
    xmax = dx * ncol
    ymin = 0.0
    ymax = abs(dy) * nrow
    dims = ("y", "x")

    y = np.arange(ymax, ymin, dy) + 0.5 * dy
    x = np.arange(xmin, xmax, dx) + 0.5 * dx
    coords = {"y": y, "x": x}

    return xr.DataArray(np.ones(shape, dtype=np.int32), coords=coords, dims=dims)


structured_grid = make_structured_grid(10, 10, 1.5, -1.5)
uda = xu.UgridDataArray.from_structured2d(structured_grid)
ugrid2d = uda.ugrid.grid

uda
Next, we create a 1D network. This network consists of 5 nodes and 4 edges. At node 2 the network forks to two branches. The data is located assigned to the nodes.
node_xy = np.array(
    [
        [0.0, 0.0],
        [5.0, 5.0],
        [10.0, 5.0],
        [15.0, 0.0],
        [15.0, 10.0],
    ]
)
edge_nodes = np.array(
    [
        [0, 1],
        [1, 2],
        [2, 3],
        [2, 4],
    ]
)
network = xu.Ugrid1d(*node_xy.T, -1, edge_nodes)
data = xr.DataArray(
    np.array([1, 1.5, 2, 4, -4], dtype=float), dims=(network.node_dimension,)
)
uda_1d = xu.UgridDataArray(data, grid=network)

uda_1d
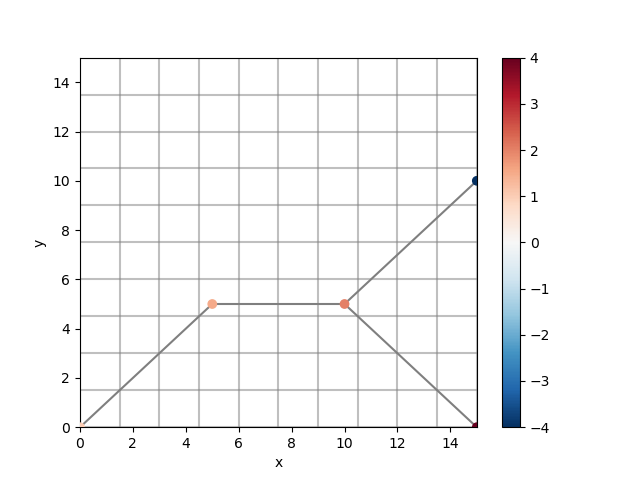
Let’s plot the 1D network on top of the 2D grid. The 1D network is shown in light gray, the 2D grid in dark gray. The network’s nodes are colored by data values.
uda_1d.ugrid.plot(zorder=10)
uda_1d.ugrid.grid.plot(color="black", alpha=0.5)
ugrid2d.plot(color="gray", alpha=0.5)
<matplotlib.collections.LineCollection object at 0x7fea66152450>
Intersect edges#
First, we need to find the intersection points between the edges of the
network and the 2D grid. We can do this by using the
xugrid.Ugrid1D.intersect_edges() method.
edges_coords = ugrid2d.node_coordinates[ugrid2d.edge_node_connectivity]
_, _, intersections_xy = network.intersect_edges(edges_coords)
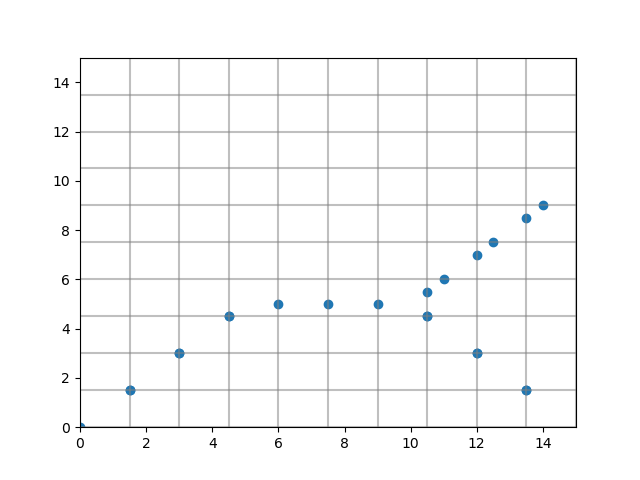
Let’s look at the intersection points.
import matplotlib.pyplot as plt

fig, ax = plt.subplots()

ugrid2d.plot(
    ax=ax,
    color="gray",
    alpha=0.5,
)
plt.scatter(*intersections_xy.T)
<matplotlib.collections.PathCollection object at 0x7feaafb5c560>
Let’s take a look at the individual values. We can see that the intersection points are located at the vertices of the 2D grid. This introduces duplicate intersection points.
intersections_xy
array([[14. ,  9. ],
       [13.5,  8.5],
       [12.5,  7.5],
       [12. ,  7. ],
       [ 4.5,  4.5],
       [ 6. ,  5. ],
       [ 7.5,  5. ],
       [ 9. ,  5. ],
       [11. ,  6. ],
       [10.5,  5.5],
       [10.5,  4.5],
       [ 4.5,  4.5],
       [ 3. ,  3. ],
       [10.5,  4.5],
       [12. ,  3. ],
       [ 3. ,  3. ],
       [ 1.5,  1.5],
       [12. ,  3. ],
       [13.5,  1.5],
       [ 1.5,  1.5],
       [ 0. ,  0. ],
       [13.5,  1.5]])
Because the line interesects cell vertices, we have duplicate intersection points. Remove duplicates by finding the uniques, as duplicates are not allowed in the network refinement we’ll do in the next step.
_intersections_xy = np.unique(intersections_xy, axis=0)

_intersections_xy
array([[ 0. ,  0. ],
       [ 1.5,  1.5],
       [ 3. ,  3. ],
       [ 4.5,  4.5],
       [ 6. ,  5. ],
       [ 7.5,  5. ],
       [ 9. ,  5. ],
       [10.5,  4.5],
       [10.5,  5.5],
       [11. ,  6. ],
       [12. ,  3. ],
       [12. ,  7. ],
       [12.5,  7.5],
       [13.5,  1.5],
       [13.5,  8.5],
       [14. ,  9. ]])
Refining the network#
Let’s refine the network by the intersection points. This will create new nodes at the intersection points and add edges between the new nodes and the original
refined_network, refined_node_index = network.refine_by_vertices(
    _intersections_xy, return_index=True
)

refined_network
<xarray.Dataset> Size: 632B
Dimensions:               (network1d_nEdges: 19, two: 2, network1d_nNodes: 20)
Coordinates:
    network1d_node_x      (network1d_nNodes) float64 160B 0.0 5.0 ... 13.5 14.0
    network1d_node_y      (network1d_nNodes) float64 160B 0.0 5.0 ... 8.5 9.0
Dimensions without coordinates: network1d_nEdges, two, network1d_nNodes
Data variables:
    network1d             int64 8B 0
    network1d_edge_nodes  (network1d_nEdges, two) int64 304B 0 5 5 6 ... 19 19 4
Attributes:
    Conventions:  CF-1.9 UGRID-1.0
We’ll create a new UgridDataArray with the refined network. The data will be set to NaN at the refined nodes. The original data will be set to the original nodes.
refined_data = xr.DataArray(
    np.empty_like(refined_network.node_x), dims=(refined_network.node_dimension,)
)
uda_1d_refined = xu.UgridDataArray(refined_data, grid=refined_network)

# Set data
node_dim = uda_1d.ugrid.grid.node_dimension
uda_1d_refined.data[uda_1d[node_dim].data] = uda_1d.data
uda_1d_refined.data[refined_node_index] = np.nan

uda_1d_refined
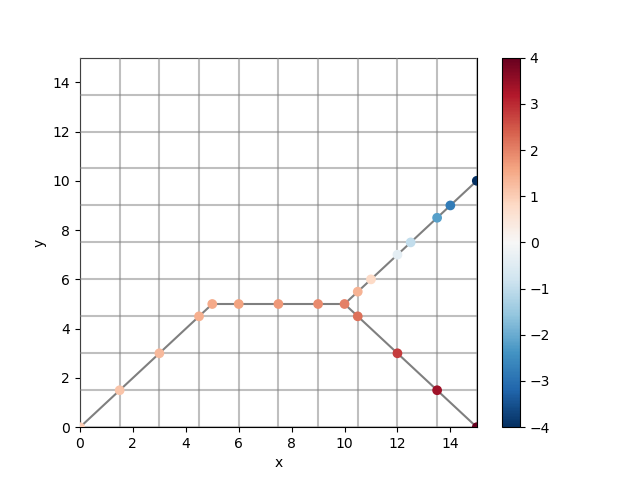
Interpolation#
Next, interpolate the data to the refined nodes, we can do this with a laplace interpolation. This nicely interpolates the data along the network: Notice that the two branches on the right-hand side are interpolated separately.
uda_1d_interpolated = uda_1d_refined.ugrid.laplace_interpolate()

fig, ax = plt.subplots()
uda_1d_interpolated.ugrid.plot(ax=ax, zorder=10)
uda_1d_interpolated.ugrid.grid.plot(ax=ax, color="black", alpha=0.5, zorder=2)
ugrid2d.plot(ax=ax, color="gray", alpha=0.5, zorder=3)
<matplotlib.collections.LineCollection object at 0x7fea65174a10>
The final step before we can grid the network is setting the data to edge centroids. We do this by averaging the data at the nodes that are connected to the edges. This is done by using the edge_node_connectivity of the network.
edge_data = xr.DataArray(
    data=uda_1d_interpolated.data[refined_network.edge_node_connectivity].mean(axis=1),
    dims=(refined_network.edge_dimension,),
)
uda_1d_edge = xu.UgridDataArray(edge_data, grid=refined_network)

fig, ax = plt.subplots()
uda_1d_edge.ugrid.plot(ax=ax, zorder=10)
ugrid2d.plot(ax=ax, color="gray", alpha=0.5, zorder=3)

<matplotlib.collections.LineCollection object at 0x7fea65177740>
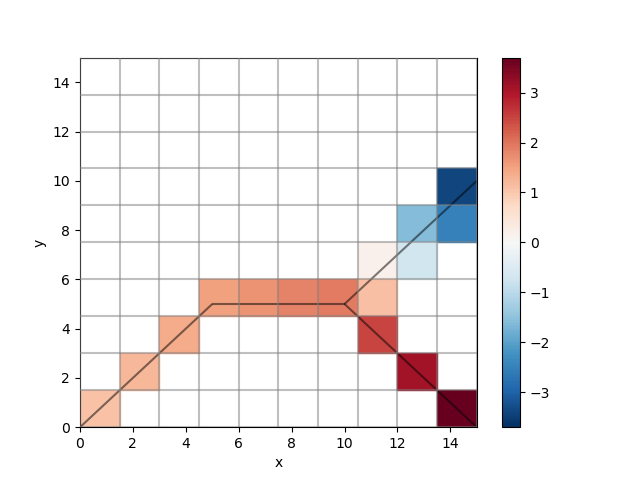
Gridding#
Finally, we can grid the data to the 2D grid. We can do this by using the
xugrid.regrid.gridder.NetworkGridder class. This class takes the
Ugrid1d grid as source and Ugrid2d grit as target, the method to use for
gridding and the data to grid.
from xugrid.regrid.gridder import NetworkGridder

gridder = NetworkGridder(
    source=uda_1d_edge.ugrid.grid,
    target=ugrid2d,
    method="mean",
)

gridder
<xugrid.regrid.gridder.NetworkGridder object at 0x7feaafbd2db0>
Next, we can grid the data. Call the
xugrid.regrid.gridder.NetworkGridder.regrid() method to grid the data.
network_gridded = gridder.regrid(uda_1d_edge)

fig, ax = plt.subplots()
network_gridded.ugrid.plot(ax=ax)
uda_1d_edge.ugrid.grid.plot(ax=ax, color="black", alpha=0.5, zorder=2)
ugrid2d.plot(ax=ax, color="gray", alpha=0.5, zorder=3)
<matplotlib.collections.LineCollection object at 0x7feaaec66270>
Total running time of the script: (0 minutes 0.358 seconds)