Tip
Example: Working with mesh models#
The main feature of HydroMT is to facilitate the process of building and analyzing spatial geoscientific models with a focus on water system models. It does so by automating the workflow to go from raw data to a complete model instance which is ready to run and to analyse model results once the simulation has finished.
This notebook will explore how to work with mesh models.
[1]:
# import hydromt and setup logging
import hydromt
from hydromt.log import setuplog

# other imports
import matplotlib.pyplot as plt
import geopandas as gpd

logger = setuplog("working with mesh models", log_level=10)
2024-04-25 17:20:34,684 - working with mesh models - log - INFO - HydroMT version: 0.9.5.dev0
Check if mesh_model is available#
To know which models are available within your active environment, you can use global MODELS variable in hydromt
[2]:
# generic model classes
print(f"Generic model classes: {hydromt.MODELS.generic}")
# model classes from external plugin
print(f"Model classes from plugins: {hydromt.MODELS.plugins}")
Generic model classes: ['grid_model', 'vector_model', 'mesh_model', 'network_model']
Model classes from plugins: []
Here you may only see the generic models grid_model, vector_model and network_model. There is one more generic model within HydroMT mesh_model which is only available if the additional python mesh dependency xugrid is available in the activated environment. If not add xugrid to your environment.
Mesh component properties and preparation with setup_mesh2d method#
The main component of MeshModel is the mesh object. The mesh object in HydroMT is defined using the UgridDataset object of the xugrid.
The mesh object is able to contain 1D, 2D and/or 3D unstructured grid(s) according to the UGRID conventions. Several grids are supported and each grid should have a name to be able to select or prepare data for a specific one.
Let’s have a look at an example of MeshModel.mesh and the available properties:
[3]:
# Instantiate a mesh model
mod = hydromt.MeshModel(
    root="data/mesh_model",
    mode="r",
)
# Read the mesh
mod.read_mesh(fn='mesh1d2d.nc', crs=3857)
# Print the mesh
print(type(mod.mesh))
mod.mesh
<class 'xugrid.core.wrap.UgridDataset'>
[3]:
<xarray.Dataset> Size: 351kB
Dimensions:                     (mesh2d_nNodes: 81, mesh2d_nFaces: 64,
                                 mesh2d_nEdges: 144, network1d_nNodes: 1014,
                                 network1d_nEdges: 1007,
                                 network1d_nGeometryNodes: 2290)
Coordinates: (12/13)
    mesh2d_node_x               (mesh2d_nNodes) float64 648B dask.array<chunksize=(81,), meta=np.ndarray>
    mesh2d_node_y               (mesh2d_nNodes) float64 648B dask.array<chunksize=(81,), meta=np.ndarray>
    mesh2d_face_x               (mesh2d_nFaces) float64 512B dask.array<chunksize=(64,), meta=np.ndarray>
    mesh2d_face_y               (mesh2d_nFaces) float64 512B dask.array<chunksize=(64,), meta=np.ndarray>
    mesh2d_edge_x               (mesh2d_nEdges) float64 1kB dask.array<chunksize=(144,), meta=np.ndarray>
    mesh2d_edge_y               (mesh2d_nEdges) float64 1kB dask.array<chunksize=(144,), meta=np.ndarray>
    ...                          ...
    network1d_edge_y            (network1d_nEdges) float64 8kB dask.array<chunksize=(1007,), meta=np.ndarray>
  * mesh2d_nNodes               (mesh2d_nNodes) int64 648B 0 1 2 3 ... 78 79 80
  * mesh2d_nEdges               (mesh2d_nEdges) int64 1kB 0 1 2 ... 141 142 143
  * network1d_nEdges            (network1d_nEdges) int64 8kB 0 1 2 ... 1005 1006
  * mesh2d_nFaces               (mesh2d_nFaces) int64 512B 0 1 2 3 ... 61 62 63
  * network1d_nNodes            (network1d_nNodes) int64 8kB 0 1 2 ... 1012 1013
Dimensions without coordinates: network1d_nGeometryNodes
Data variables:
    network1d_node_x            (network1d_nNodes) float64 8kB dask.array<chunksize=(1014,), meta=np.ndarray>
    network1d_node_y            (network1d_nNodes) float64 8kB dask.array<chunksize=(1014,), meta=np.ndarray>
    network1d_node_id           (network1d_nNodes) |S40 41kB dask.array<chunksize=(1014,), meta=np.ndarray>
    network1d_node_long_name    (network1d_nNodes) |S80 81kB dask.array<chunksize=(1014,), meta=np.ndarray>
    network1d_branch_id         (network1d_nEdges) |S40 40kB dask.array<chunksize=(1007,), meta=np.ndarray>
    network1d_branch_long_name  (network1d_nEdges) |S80 81kB dask.array<chunksize=(1007,), meta=np.ndarray>
    network1d_edge_length       (network1d_nEdges) float64 8kB dask.array<chunksize=(1007,), meta=np.ndarray>
    network1d_branch_order      (network1d_nEdges) int32 4kB dask.array<chunksize=(1007,), meta=np.ndarray>
    network1d_geometry          int32 4B ...
    network1d_geom_node_count   (network1d_nEdges) int32 4kB dask.array<chunksize=(1007,), meta=np.ndarray>
    network1d_geom_x            (network1d_nGeometryNodes) float64 18kB dask.array<chunksize=(2290,), meta=np.ndarray>
    network1d_geom_y            (network1d_nGeometryNodes) float64 18kB dask.array<chunksize=(2290,), meta=np.ndarray>
Attributes: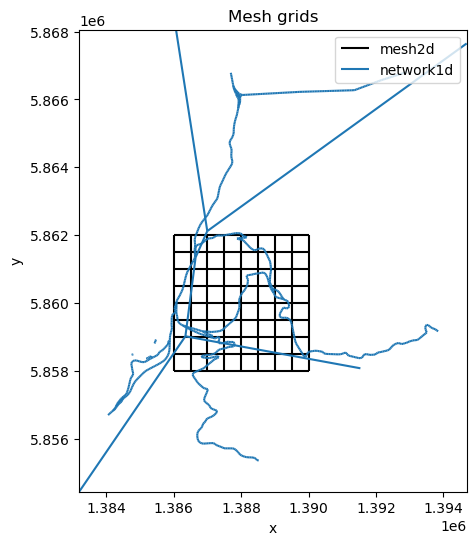
Conventions: CF-1.8 UGRID-1.0In HydroMT, you have a couple of properties that allow you to get the names of the different grids in mesh mesh_names, extract a specific grid from the mesh with mesh_datasets or without data mesh_grids or convert the grids to geopandas.GeoDataFrame mesh_gdf.
Let’s check the available grids in our mesh and plot them:
[4]:
mod.mesh_names
[4]:
['mesh2d', 'network1d']
[5]:
# Plot the different mesh grids
fig, ax = plt.subplots(figsize = (5, 6))
# Mesh2d
mod.mesh_grids["mesh2d"].plot(ax=ax, facecolor="none", edgecolor="k", label="mesh2d")
# Mesh1d
mod.mesh_grids["network1d"].plot(ax=ax, label="network1d")

# Plot legends
ax.legend()
ax.set_title("Mesh grids")
ax.set_xlabel("x")
ax.set_ylabel("y")
[5]:
Text(0, 0.5, 'y')
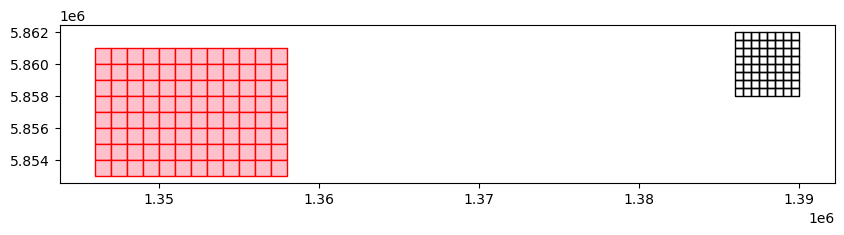
With HydroMT, you can create a 2D mesh grid using the setup_mesh2d method. This method parses the HydroMT region option to define the geographic region of interest and mesh of the MeshModel to build and once done, adds region into the geoms component and 2D grid into the mesh component. You can check the required arguments in the
docs.
With this method, you can generate a 2D regular mesh within a bounding box or geometry, or from reading an existing mesh file. We will see an example for both of them.
[6]:
# First instantiate a new mesh model
root = "tmp_mesh_model"
mod = hydromt.MeshModel(
    root=root,
    mode="w",
    data_libs=["artifact_data", "data/vito_reclass.yml"],
    logger=logger,
)
2024-04-25 17:20:35,128 - working with mesh models - data_catalog - INFO - Reading data catalog archive artifact_data v0.0.8
2024-04-25 17:20:35,129 - working with mesh models - data_catalog - INFO - Parsing data catalog from /home/runner/.hydromt_data/artifact_data/v0.0.8/data_catalog.yml
2024-04-25 17:20:35,174 - working with mesh models - data_catalog - INFO - Parsing data catalog from data/vito_reclass.yml
2024-04-25 17:20:35,176 - working with mesh models - log - DEBUG - Writing log messages to new file /home/runner/work/hydromt/hydromt/docs/_examples/tmp_mesh_model/hydromt.log.
2024-04-25 17:20:35,176 - working with mesh models - model_api - INFO - Initializing mesh_model model from hydromt (v0.9.5.dev0).
[7]:
# Generate a 2D mesh from file
region = {'mesh': 'data/mesh_model/mesh1d2d.nc', 'grid_name': 'mesh2d'}
mod._mesh = None # delete the previous mesh
mod.setup_mesh2d(
    region=region,
    crs = 3857,
    grid_name="mesh2d",
)
# Save and reset mesh
mesh1 = mod.mesh_gdf["mesh2d"].copy()
mod._mesh = None

# Generate a 2D mesh from bounding box and resolution
region = {'bbox': [12.09, 46.45, 12.20, 46.50]}
mod.setup_mesh2d(
    region=region,
    res=1000,
    crs=3857,
    grid_name="mesh2d",
)
# Save and reset mesh
mesh2 = mod.mesh_gdf["mesh2d"].copy()
2024-04-25 17:20:35,182 - working with mesh models - model_mesh - INFO - Preparing 2D mesh.
2024-04-25 17:20:35,203 - working with mesh models - basin_mask - DEBUG - Parsed region (kind=mesh): {'grid_name': 'mesh2d', 'mesh': <xarray.Dataset> Size: 351kB
Dimensions:                     (mesh2d_nNodes: 81, mesh2d_nFaces: 64,
                                 mesh2d_nEdges: 144, network1d_nNodes: 1014,
                                 network1d_nEdges: 1007,
                                 network1d_nGeometryNodes: 2290)
Coordinates: (12/14)
    mesh2d_node_x               (mesh2d_nNodes) float64 648B ...
    mesh2d_node_y               (mesh2d_nNodes) float64 648B ...
    mesh2d_face_x               (mesh2d_nFaces) float64 512B ...
    mesh2d_face_y               (mesh2d_nFaces) float64 512B ...
    mesh2d_edge_x               (mesh2d_nEdges) float64 1kB ...
    mesh2d_edge_y               (mesh2d_nEdges) float64 1kB ...
    ...                          ...
    spatial_ref                 int32 4B ...
  * mesh2d_nNodes               (mesh2d_nNodes) int64 648B 0 1 2 3 ... 78 79 80
  * mesh2d_nEdges               (mesh2d_nEdges) int64 1kB 0 1 2 ... 141 142 143
  * network1d_nEdges            (network1d_nEdges) int64 8kB 0 1 2 ... 1005 1006
  * mesh2d_nFaces               (mesh2d_nFaces) int64 512B 0 1 2 3 ... 61 62 63
  * network1d_nNodes            (network1d_nNodes) int64 8kB 0 1 2 ... 1012 1013
Dimensions without coordinates: network1d_nGeometryNodes
Data variables:
    network1d_node_x            (network1d_nNodes) float64 8kB ...
    network1d_node_y            (network1d_nNodes) float64 8kB ...
    network1d_node_id           (network1d_nNodes) |S40 41kB ...
    network1d_node_long_name    (network1d_nNodes) |S80 81kB ...
    network1d_branch_id         (network1d_nEdges) |S40 40kB ...
    network1d_branch_long_name  (network1d_nEdges) |S80 81kB ...
    network1d_edge_length       (network1d_nEdges) float64 8kB ...
    network1d_branch_order      (network1d_nEdges) int32 4kB ...
    network1d_geometry          int32 4B ...
    network1d_geom_node_count   (network1d_nEdges) int32 4kB ...
    network1d_geom_x            (network1d_nGeometryNodes) float64 18kB ...
    network1d_geom_y            (network1d_nGeometryNodes) float64 18kB ...
Attributes:
    Conventions:  CF-1.8 UGRID-1.0}
2024-04-25 17:20:35,210 - working with mesh models - mesh - WARNING - Mesh data from mesh file doesn't have a CRS. Assuming crs option EPSG:3857
2024-04-25 17:20:35,217 - working with mesh models - model_mesh - INFO - Preparing 2D mesh.
2024-04-25 17:20:35,217 - working with mesh models - basin_mask - DEBUG - Parsed region (kind=bbox): {'bbox': [12.09, 46.45, 12.2, 46.5]}
[8]:
# Plot
fig = plt.figure(figsize=(10, 4))
ax = plt.subplot()
# plot mesh1 mesh2 gdf without facecolor
mesh1.plot(ax=ax, facecolor="none", edgecolor="k", label="mesh from bbox")
mesh2.plot(ax=ax, facecolor="pink", edgecolor="r", label="mesh from file")
[8]:
<Axes: >
Add data to 2D mesh#
To prepare and resample data to a 2D grid in mesh, the core for now has two methods available: setup_mesh2d_from_rasterdataset and setup_mesh2d_from_raster_reclass.
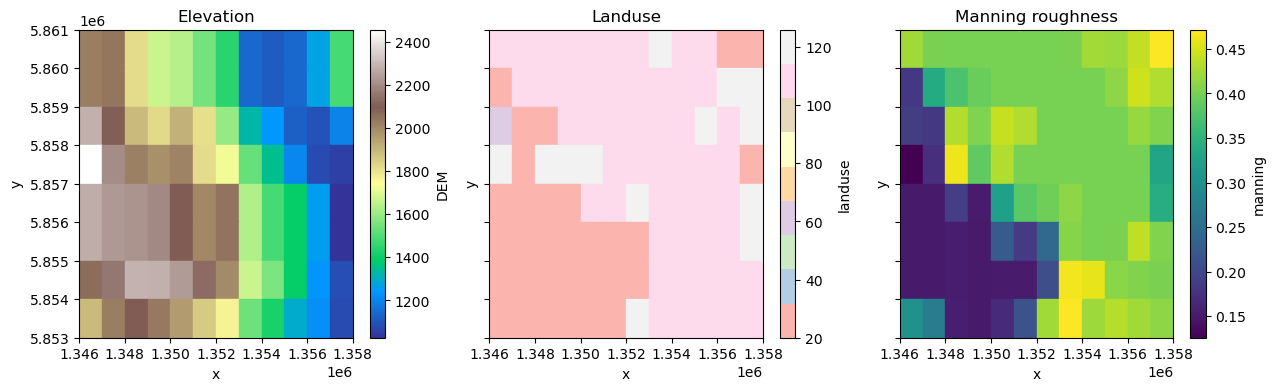
But back to our example, let’s add both a DEM map from the data source merit_hydro_1k and a landuse and manning roughness map based on reclassified landuse data from the vito dataset to the mesh2d grid of our model mesh object.
For this we will use xugrid Regridder methods to interpolate raster data to our mesh. Our current model resolution is 500*500 meters so for the different data source we will resample using the methods:
merit_hydro_1k: centroid as the resolution of the data is 1000*1000 meters. You could also choose mean or geometric_mean or others if you wish.
landuse: mode (most representative) as we want to conserve the land use classification values.
manning: the resolution of vito is 250250 meters so we can choose to use for example the mean* method.
[9]:
mod.setup_mesh2d_from_rasterdataset(
    raster_fn="merit_hydro_1k",
    grid_name="mesh2d",
    variables="elevtn",
    fill_method=None,
    resampling_method="centroid",
    rename={"elevtn": "DEM"},
)
mod.setup_mesh2d_from_raster_reclass(
    raster_fn="vito",
    grid_name="mesh2d",
    fill_method="nearest",
    reclass_table_fn="vito_reclass",  # Note: from local data catalog
    reclass_variables=["landuse", "manning"],
    resampling_method=["mode", "mean"],
)
2024-04-25 17:20:35,365 - working with mesh models - model_mesh - INFO - Preparing mesh data from raster source merit_hydro_1k
2024-04-25 17:20:35,372 - working with mesh models - rasterdataset - INFO - Reading merit_hydro_1k raster data from /home/runner/.hydromt_data/artifact_data/v0.0.8/merit_hydro_1k/{variable}.tif
2024-04-25 17:20:35,389 - working with mesh models - rasterdataset - DEBUG - Clip to [12.091, 46.452, 12.199, 46.501] (epsg:4326))
2024-04-25 17:20:35,395 - working with mesh models - mesh - INFO - Preparing regridder for centroid method
2024-04-25 17:20:40,588 - working with mesh models - mesh - INFO - Resampling elevtn to mesh2d using centroid method
2024-04-25 17:20:40,602 - working with mesh models - model_mesh - INFO - Preparing mesh data by reclassifying the data in vito based on vito_reclass.
2024-04-25 17:20:40,607 - working with mesh models - rasterdataset - INFO - Reading vito raster data from /home/runner/.hydromt_data/artifact_data/v0.0.8/vito.tif
2024-04-25 17:20:40,620 - working with mesh models - rasterdataset - DEBUG - Clip to [12.091, 46.452, 12.199, 46.501] (epsg:4326))
2024-04-25 17:20:40,622 - working with mesh models - dataframe - INFO - Reading vito_reclass csv data from /home/runner/work/hydromt/hydromt/docs/_examples/data/vito_reclass.csv
2024-04-25 17:20:40,652 - working with mesh models - mesh - INFO - Preparing regridder for mean method
2024-04-25 17:20:49,528 - working with mesh models - mesh - INFO - Preparing regridder for mode method
2024-04-25 17:20:49,530 - working with mesh models - mesh - INFO - Resampling landuse to mesh2d using mode method
2024-04-25 17:20:50,785 - working with mesh models - mesh - INFO - Resampling manning to mesh2d using mean method
[9]:
['landuse', 'manning']
[10]:
# Plot
fig, axes = plt.subplots(nrows=1, ncols=3, figsize=(15, 4), sharey=True)
mod.mesh["DEM"].ugrid.plot(ax=axes[0], cmap="terrain")
axes[0].set_title("Elevation")

mod.mesh["landuse"].ugrid.plot(ax=axes[1], cmap="Pastel1")
axes[1].set_title("Landuse")

mod.mesh["manning"].ugrid.plot(ax=axes[2], cmap="viridis")
axes[2].set_title("Manning roughness")
[10]:
Text(0.5, 1.0, 'Manning roughness')