Tip
Example: Working with models in Python#
The main feature of HydroMT is to facilitate the process of building and analyzing spatial geoscientific models with a focus on water system models. It does so by automating the workflow to go from raw data to a complete model instance which is ready to run and to analyse model results once the simulation has finished.
This notebook will explore how to work with HydroMT models in Python.
[1]:
import geopandas as gpd

# other imports
import matplotlib as mpl
import matplotlib.pyplot as plt
import numpy as np
import pandas as pd

import hydromt
from hydromt import log

log.initialize_logging()
/home/runner/work/hydromt/hydromt/.pixi/envs/default/lib/python3.14/site-packages/tqdm/auto.py:21: TqdmWarning: IProgress not found. Please update jupyter and ipywidgets. See https://ipywidgets.readthedocs.io/en/stable/user_install.html
  from .autonotebook import tqdm as notebook_tqdm
2026-07-02 09:56:55,040 - hydromt - log - INFO - HydroMT version: 1.5.0.dev0
Available models and components in HydroMT#
To know which models are available within your active environment, you can use global PLUGINS variable in hydromt
[2]:
# generic model classes
print(f"Model classes: {hydromt.PLUGINS.model_summary()}")
# model classes from external plugin
print(f"Model components: {hydromt.PLUGINS.component_summary()}")
Model classes: Model plugins:
        - model (hydromt 1.5.0.dev0)
        - example_model (hydromt 1.5.0.dev0)
Model components: Component plugins:
        - ConfigComponent (hydromt 1.5.0.dev0)
        - DatasetsComponent (hydromt 1.5.0.dev0)
        - GeomsComponent (hydromt 1.5.0.dev0)
        - GridComponent (hydromt 1.5.0.dev0)
        - MeshComponent (hydromt 1.5.0.dev0)
        - SpatialDatasetsComponent (hydromt 1.5.0.dev0)
        - TablesComponent (hydromt 1.5.0.dev0)
        - VectorComponent (hydromt 1.5.0.dev0)
Here you see that we have available the core model and example_model and many generic components from core.
Apart from ConfigComponent, the other components do not methods to easily add data to them. So in this notebook, we will then use the example_model.
Model components#
HydroMT defines any model through the model-agnostic Model API. By default, Model does not contain any components but these can be added during instantiation. Subclasses of Model, for example here ExampleModel will usually already contain several components. This is for example the case if you are using a HydroMT plugin such as hydromt_wflow which will define WflowSbmModel and WflowSedimentModel.
But back to our ExampleModel class. Let’s see which components make this model:
[3]:
from hydromt.model import ExampleModel

model = ExampleModel()
model.components
2026-07-02 09:56:55,077 - hydromt.model.model - model - INFO - Initializing example_model model from hydromt (v1.5.0.dev0).
[3]:
{'config': <hydromt.model.components.config.ConfigComponent at 0x7f5686d9d7f0>,
 'grid': <hydromt.model.example.example_grid_component.ExampleGridComponent at 0x7f565c22a660>}
We see here that ExampleModel is made of two components:
configfor the example model simulation settings filegridfor the gridded data of example model. In this case, you see that the grid is of typeExampleGridComponent. This component actually contains two methods that we can use to populate our grid with data:create_from_regionandadd_data_from_rasterdataset.
Building a model step-by-step#
To fill in our model components with data, HydroMT uses steps or setup_ methods. These methods go from reading input data using the DataCatalog, transforming the data using processes (e.g. reprojection, deriving model parameters, etc…) and adding the new model data to the right model component.
Here, we will only have the following methods to add data to our model:
config: update
We are here a little limited but if you are using a plugin, check their documentation to get some inspiration!
Let’s start populating our model by first creating a grid using grid.create_from_region. This method parses the HydroMT region option to define the geographic region of interest and grid of the GridModel to build and once done our ExampleModel will have a region property available.
Let’s use for region a subbasin for any point in the Piave basin. We first initialize a ExampleModel instance in writing mode at a model root folder. Data is sourced from the artifact_data pre-defined catalog.
[4]:
root = "tmp_example_model_py"
model = ExampleModel(
    root=root,
    mode="w+",
    data_libs=["artifact_data"],
)
2026-07-02 09:56:55,098 - hydromt.data_catalog.data_catalog - data_catalog - INFO - Reading data catalog artifact_data latest
2026-07-02 09:56:55,099 - hydromt.data_catalog.data_catalog - data_catalog - INFO - Parsing data catalog from /home/runner/.hydromt/artifact_data/v1.0.0/data_catalog.yml
2026-07-02 09:56:55,728 - hydromt.model.model - model - INFO - Initializing example_model model from hydromt (v1.5.0.dev0).
[5]:
xy = [12.2051, 45.8331]
region = {"subbasin": xy, "uparea": 50}
model.grid.create_from_region(
    region=region,
    res=1000,
    crs="utm",
    hydrography_path="merit_hydro",
    basin_index_path="merit_hydro_index",
)
model.grid.data
2026-07-02 09:56:55,733 - hydromt.hydromt.model.example.example_grid_component - example_grid_component - INFO - Preparing 2D grid.
2026-07-02 09:56:55,734 - hydromt.data_catalog.sources.data_source - data_source - INFO - Reading merit_hydro RasterDataset data from /home/runner/.hydromt/artifact_data/latest/merit_hydro/{variable}.tif
2026-07-02 09:56:55,807 - hydromt.data_catalog.sources.data_source - data_source - INFO - Reading merit_hydro_index GeoDataFrame data from /home/runner/.hydromt/artifact_data/latest/merit_hydro_index.gpkg
2026-07-02 09:56:56,063 - hydromt.model.processes.basin_mask - basin_mask - INFO - subbasin bbox: [11.7750, 45.8042, 12.7450, 46.6900]
2026-07-02 09:56:56,097 - hydromt.data_catalog.sources.data_source - data_source - INFO - Reading merit_hydro RasterDataset data from /home/runner/.hydromt/artifact_data/latest/merit_hydro/{variable}.tif
[5]:
<xarray.Dataset> Size: 10kB
Dimensions: (y: 102, x: 80)
Coordinates:
* y (y) float64 816B 5.176e+06 5.174e+06 ... 5.076e+06 5.074e+06
* x (x) float64 640B 2.495e+05 2.505e+05 ... 3.275e+05 3.285e+05
spatial_ref int64 8B 0
Data variables:
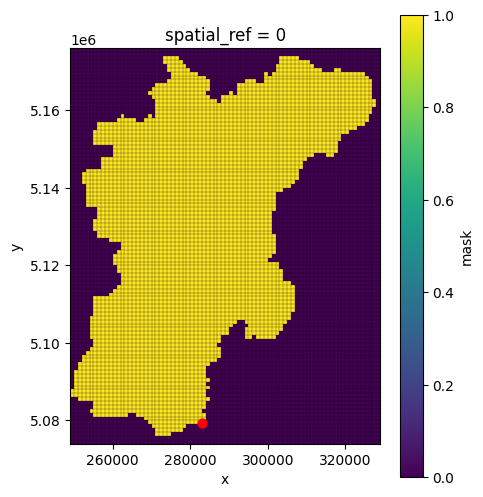
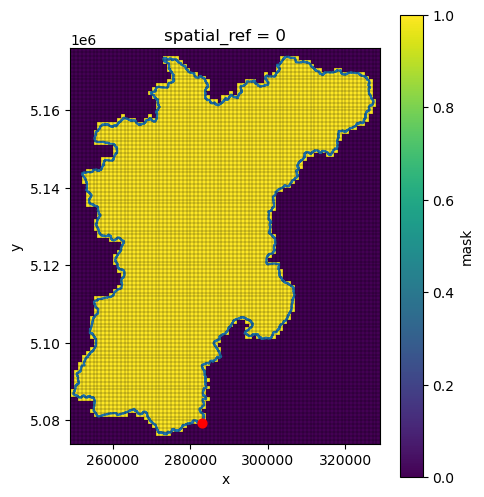
mask (y, x) bool 8kB False False False False ... False False False[6]:
# Plot
fig = plt.figure(figsize=(5, 6))
ax = plt.subplot()
# grid mask
model.grid.data["mask"].plot(ax=ax)
# grid vector cells using hydromt.raster.vector_grid method
model.grid.data["mask"].raster.vector_grid().boundary.plot(
    ax=ax, color="black", linewidth=0.1
)
# the outlet point we used to derive region
gdf_xy = gpd.GeoDataFrame(geometry=gpd.points_from_xy(x=[xy[0]], y=[xy[1]]), crs=4326)
gdf_xy.to_crs(model.crs).plot(ax=ax, markersize=40, c="red", zorder=2)
[6]:
<Axes: title={'center': 'spatial_ref = 0'}, xlabel='x', ylabel='y'>
Similarly, we can also populate the config component using the config.update method. For HydroMT, config represents the configuration of the model kernel, e.g. the file that would fix your model kernel run settings or list of outputs etc. For most models, this is usually a text file (for example .yaml, .ini, .toml, .inp formats) that can be ordered in sections. Within HydroMT, we then use the dictionary object to represent each header/setting/value.
Let’s populate our config with some simple settings:
[7]:
config_data = {
    "header": {"setting": "value"},
    "timers": {"start": "2010-02-05", "end": "2010-02-15"},
}

model.config.update(data=config_data)
model.config.data
[7]:
{'header': {'setting': 'value'},
 'timers': {'start': '2010-02-05', 'end': '2010-02-15'}}
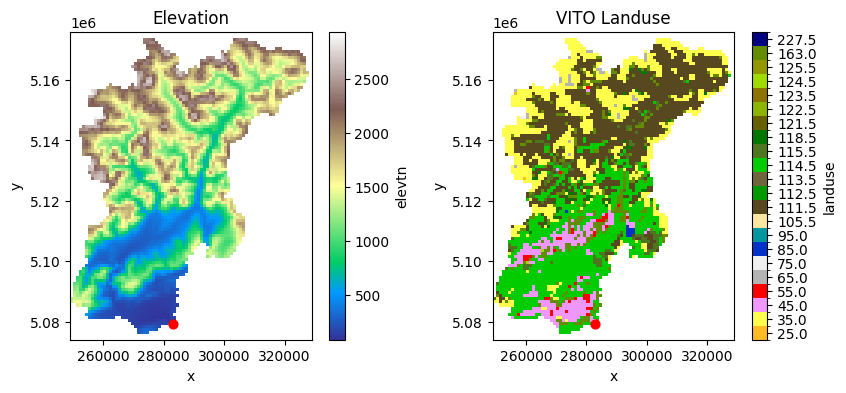
We can now add data to our grid component with the method grid.add_data_from_rasterdataset. Let’s add both a DEM map from the data source merit_hydro_ihu and a landuse map using vito_2015 dataset to our model grid object.
[8]:
model.grid.add_data_from_rasterdataset(
    raster_data="merit_hydro_ihu",
    variables=["elevtn"],
    reproject_method="bilinear",
)
model.grid.add_data_from_rasterdataset(
    raster_data="vito_2015",
    fill_method="nearest",
    reproject_method="mode",
    rename={"vito": "landuse"},
)
2026-07-02 09:56:56,844 - hydromt.hydromt.model.example.example_grid_component - example_grid_component - INFO - Preparing grid data from raster source merit_hydro_ihu
2026-07-02 09:56:56,846 - hydromt.data_catalog.sources.data_source - data_source - INFO - Reading merit_hydro_ihu RasterDataset data from /home/runner/.hydromt/artifact_data/latest/merit_hydro_1k/{variable}.tif
2026-07-02 09:56:56,868 - hydromt.hydromt.model.example.example_grid_component - example_grid_component - INFO - Preparing grid data from raster source vito_2015
2026-07-02 09:56:56,871 - hydromt.data_catalog.sources.data_source - data_source - INFO - Reading vito_2015 RasterDataset data from /home/runner/.hydromt/artifact_data/latest/vito.tif
[9]:
# check which maps are read
print(f"model grid: {list(model.grid.data.data_vars)}")

model.grid.data["elevtn"]
model grid: ['mask', 'elevtn', 'landuse']
[9]:
<xarray.DataArray 'elevtn' (y: 102, x: 80)> Size: 33kB
array([[-9999., -9999., -9999., ..., -9999., -9999., -9999.],
       [-9999., -9999., -9999., ..., -9999., -9999., -9999.],
       [-9999., -9999., -9999., ..., -9999., -9999., -9999.],
       ...,
       [-9999., -9999., -9999., ..., -9999., -9999., -9999.],
       [-9999., -9999., -9999., ..., -9999., -9999., -9999.],
       [-9999., -9999., -9999., ..., -9999., -9999., -9999.]],
      shape=(102, 80), dtype=float32)
Coordinates:
  * y            (y) float64 816B 5.176e+06 5.174e+06 ... 5.076e+06 5.074e+06
  * x            (x) float64 640B 2.495e+05 2.505e+05 ... 3.275e+05 3.285e+05
    spatial_ref  int64 8B 0
Attributes:
    AREA_OR_POINT:  Area
    _FillValue:     -9999.0
source_file: elevtn.tif[10]:
# Plot
fig, axes = plt.subplots(nrows=1, ncols=2, figsize=(10, 4))
# Elevation
model.grid.data["elevtn"].raster.mask_nodata().plot(ax=axes[0], cmap="terrain")
gdf_xy = gpd.GeoDataFrame(
    geometry=gpd.points_from_xy(x=[xy[0]], y=[xy[1]]), crs=4326
).to_crs(model.crs)
gdf_xy.plot(ax=axes[0], markersize=40, c="red", zorder=2)
axes[0].set_title("Elevation")

# VITO landuse
df = pd.read_csv("./legends/vito-label-qgis.txt", header=None, index_col=0)
levels = df.index
colors = (df.iloc[:-1, :4] / 255).values
ticklabs = df.iloc[:-1, 4].values
cmap, norm = mpl.colors.from_levels_and_colors(levels, colors)
ticks = np.array(levels[:-1]) + np.diff(levels) / 2.0

model.grid.data["landuse"].plot(
    ax=axes[1], cmap=cmap, norm=norm, cbar_kwargs=dict(ticks=ticks)
)
gdf_xy.plot(ax=axes[1], markersize=40, c="red", zorder=2)
axes[1].set_title("VITO Landuse")
[10]:
Text(0.5, 1.0, 'VITO Landuse')
Model read & write methods#
Once our model is filled up with data, we can then write it down using either the general write method or component specific component.write methods. Similarly, our model can be read back with the general read method or component specific ones.
Let’s now write our model into a model root folder.
[11]:
model.write(components=["grid", "config"])
2026-07-02 09:56:57,398 - hydromt.model.components.grid - grid - INFO - example_model.grid: Writing grid data to /home/runner/work/hydromt/hydromt/docs/_examples/tmp_example_model_py/grid.nc.
2026-07-02 09:56:57,406 - hydromt.model.components.config - config - INFO - example_model.config: Writing model config to /home/runner/work/hydromt/hydromt/docs/_examples/tmp_example_model_py/settings.toml.
[12]:
# print MODEL_ROOT folder
import os


def print_dir(root):
    for path, _, files in os.walk(root):
        print(path)
        for name in files:
            if name.endswith(".xml"):
                continue
            print(f" - {name}")


print_dir(root)
tmp_example_model_py
 - settings.toml
 - grid.nc
And now let’s read it back in a new ExampleModel instance:
[13]:
model2 = ExampleModel(root=root, mode="r")
model2.read(components=["config", "grid"])
2026-07-02 09:56:57,415 - hydromt.model.model - model - INFO - Initializing example_model model from hydromt (v1.5.0.dev0).
2026-07-02 09:56:57,416 - hydromt.model.model - model - INFO - Reading model data from /home/runner/work/hydromt/hydromt/docs/_examples/tmp_example_model_py
2026-07-02 09:56:57,416 - hydromt.model.components.config - config - INFO - Reading model config file from /home/runner/work/hydromt/hydromt/docs/_examples/tmp_example_model_py/settings.toml.
[14]:
# check which grid are read
print(f"model grid: {list(model2.grid.data.data_vars)}")
model grid: ['mask', 'elevtn', 'landuse']
Building / updating a model with python#
Using the same functionalities, it is also possible to build or update a model within python instead of using the command line, using the build and update methods. Let’s see how we could rebuild our previous ExampleModel with the build method.
First let’s start with writing a HydroMT build workflow file with the ExampleModel (steps) methods we want to use.
[15]:
%%writefile tmp_build_example_model_py.yml

steps:
  - config.update:
      data:
        header.settings: value
        timers.end: "2010-02-15"
        timers.start: "2010-02-05"
  - grid.create_from_region:
      region:
        subbasin: [12.2051, 45.8331]
        uparea: 50
      res: 1000
      crs: utm
      hydrography_path: merit_hydro
      basin_index_path: merit_hydro_index
  - grid.add_data_from_rasterdataset:
      raster_data: merit_hydro_ihu
      variables:
        - elevtn
      reproject_method:
        - bilinear
  - grid.add_data_from_rasterdataset:
      raster_data: vito_2015
      fill_method: nearest
      reproject_method: mode
      rename:
        vito: landuse
Writing tmp_build_example_model_py.yml
And now let’s build our model:
[16]:
from hydromt.readers import read_workflow_yaml

# First we instantiate ExampleModel with the output folder and use the write mode (build from scratch)
root3 = "tmp_example_model_py1"
model3 = ExampleModel(
    root=root3,
    mode="w+",
    data_libs=["artifact_data"],
)

# Read the workflow file
_, _, build_options = read_workflow_yaml("./tmp_build_example_model_py.yml")

# Now let's build it with the config file
model3.build(steps=build_options)
2026-07-02 09:56:57,454 - hydromt.data_catalog.data_catalog - data_catalog - INFO - Reading data catalog artifact_data latest
2026-07-02 09:56:57,454 - hydromt.data_catalog.data_catalog - data_catalog - INFO - Parsing data catalog from /home/runner/.hydromt/artifact_data/v1.0.0/data_catalog.yml
2026-07-02 09:56:58,034 - hydromt.model.model - model - INFO - Initializing example_model model from hydromt (v1.5.0.dev0).
2026-07-02 09:56:58,036 - hydromt - log - INFO - HydroMT version: 1.5.0.dev0
2026-07-02 09:56:58,037 - hydromt.model.model - model - INFO - build: config.update
2026-07-02 09:56:58,038 - hydromt.model.model - model - INFO - config.update.data={'header.settings': 'value', 'timers.end': '2010-02-15', 'timers.start': '2010-02-05'}
2026-07-02 09:56:58,038 - hydromt.model.model - model - INFO - build: grid.create_from_region
2026-07-02 09:56:58,039 - hydromt.model.model - model - INFO - grid.create_from_region.res=1000
2026-07-02 09:56:58,039 - hydromt.model.model - model - INFO - grid.create_from_region.crs=utm
2026-07-02 09:56:58,039 - hydromt.model.model - model - INFO - grid.create_from_region.region_crs=4326
2026-07-02 09:56:58,040 - hydromt.model.model - model - INFO - grid.create_from_region.rotated=False
2026-07-02 09:56:58,040 - hydromt.model.model - model - INFO - grid.create_from_region.hydrography_path=merit_hydro
2026-07-02 09:56:58,040 - hydromt.model.model - model - INFO - grid.create_from_region.basin_index_path=merit_hydro_index
2026-07-02 09:56:58,041 - hydromt.model.model - model - INFO - grid.create_from_region.add_mask=True
2026-07-02 09:56:58,041 - hydromt.model.model - model - INFO - grid.create_from_region.align=True
2026-07-02 09:56:58,042 - hydromt.model.model - model - INFO - grid.create_from_region.dec_origin=0
2026-07-02 09:56:58,042 - hydromt.model.model - model - INFO - grid.create_from_region.dec_rotation=3
2026-07-02 09:56:58,042 - hydromt.model.model - model - INFO - grid.create_from_region.region={'subbasin': [12.2051, 45.8331], 'uparea': 50}
2026-07-02 09:56:58,043 - hydromt.hydromt.model.example.example_grid_component - example_grid_component - INFO - Preparing 2D grid.
2026-07-02 09:56:58,043 - hydromt.data_catalog.sources.data_source - data_source - INFO - Reading merit_hydro RasterDataset data from /home/runner/.hydromt/artifact_data/latest/merit_hydro/{variable}.tif
2026-07-02 09:56:58,101 - hydromt.data_catalog.sources.data_source - data_source - INFO - Reading merit_hydro_index GeoDataFrame data from /home/runner/.hydromt/artifact_data/latest/merit_hydro_index.gpkg
2026-07-02 09:56:58,324 - hydromt.model.processes.basin_mask - basin_mask - INFO - subbasin bbox: [11.7750, 45.8042, 12.7450, 46.6900]
2026-07-02 09:56:58,358 - hydromt.data_catalog.sources.data_source - data_source - INFO - Reading merit_hydro RasterDataset data from /home/runner/.hydromt/artifact_data/latest/merit_hydro/{variable}.tif
2026-07-02 09:56:58,691 - hydromt.model.model - model - INFO - build: grid.add_data_from_rasterdataset
2026-07-02 09:56:58,692 - hydromt.model.model - model - INFO - grid.add_data_from_rasterdataset.variables=['elevtn']
2026-07-02 09:56:58,693 - hydromt.model.model - model - INFO - grid.add_data_from_rasterdataset.fill_method=None
2026-07-02 09:56:58,693 - hydromt.model.model - model - INFO - grid.add_data_from_rasterdataset.reproject_method=['bilinear']
2026-07-02 09:56:58,694 - hydromt.model.model - model - INFO - grid.add_data_from_rasterdataset.mask_name=mask
2026-07-02 09:56:58,694 - hydromt.model.model - model - INFO - grid.add_data_from_rasterdataset.rename=None
2026-07-02 09:56:58,694 - hydromt.model.model - model - INFO - grid.add_data_from_rasterdataset.raster_data=merit_hydro_ihu
2026-07-02 09:56:58,696 - hydromt.hydromt.model.example.example_grid_component - example_grid_component - INFO - Preparing grid data from raster source merit_hydro_ihu
2026-07-02 09:56:58,699 - hydromt.data_catalog.sources.data_source - data_source - INFO - Reading merit_hydro_ihu RasterDataset data from /home/runner/.hydromt/artifact_data/latest/merit_hydro_1k/{variable}.tif
2026-07-02 09:56:58,718 - hydromt.model.model - model - INFO - build: grid.add_data_from_rasterdataset
2026-07-02 09:56:58,719 - hydromt.model.model - model - INFO - grid.add_data_from_rasterdataset.variables=None
2026-07-02 09:56:58,719 - hydromt.model.model - model - INFO - grid.add_data_from_rasterdataset.fill_method=nearest
2026-07-02 09:56:58,720 - hydromt.model.model - model - INFO - grid.add_data_from_rasterdataset.reproject_method=mode
2026-07-02 09:56:58,720 - hydromt.model.model - model - INFO - grid.add_data_from_rasterdataset.mask_name=mask
2026-07-02 09:56:58,721 - hydromt.model.model - model - INFO - grid.add_data_from_rasterdataset.rename={'vito': 'landuse'}
2026-07-02 09:56:58,721 - hydromt.model.model - model - INFO - grid.add_data_from_rasterdataset.raster_data=vito_2015
2026-07-02 09:56:58,721 - hydromt.hydromt.model.example.example_grid_component - example_grid_component - INFO - Preparing grid data from raster source vito_2015
2026-07-02 09:56:58,724 - hydromt.data_catalog.sources.data_source - data_source - INFO - Reading vito_2015 RasterDataset data from /home/runner/.hydromt/artifact_data/latest/vito.tif
2026-07-02 09:56:58,757 - hydromt.model.components.config - config - INFO - example_model.config: Writing model config to /home/runner/work/hydromt/hydromt/docs/_examples/tmp_example_model_py1/settings.toml.
2026-07-02 09:56:58,758 - hydromt.model.components.grid - grid - INFO - example_model.grid: Writing grid data to /home/runner/work/hydromt/hydromt/docs/_examples/tmp_example_model_py1/grid.nc.
[17]:
print_dir(root3)
tmp_example_model_py1
 - hydromt.log
 - settings.toml
 - grid.nc
And check that the results are similar to our one-by-one setup earlier:
[18]:
model3.config.data
[18]:
{'header': {'settings': 'value'},
 'timers': {'end': '2010-02-15', 'start': '2010-02-05'}}
[19]:
# Plot
fig, axes = plt.subplots(nrows=1, ncols=2, figsize=(10, 4))
# Elevation
model3.grid.data["elevtn"].raster.mask_nodata().plot(ax=axes[0], cmap="terrain")
gdf_xy = gpd.GeoDataFrame(
    geometry=gpd.points_from_xy(x=[xy[0]], y=[xy[1]]), crs=4326
).to_crs(model3.crs)
gdf_xy.plot(ax=axes[0], markersize=40, c="red", zorder=2)
axes[0].set_title("Elevation")

# VITO landuse
df = pd.read_csv("./legends/vito-label-qgis.txt", header=None, index_col=0)
levels = df.index
colors = (df.iloc[:-1, :4] / 255).values
ticklabs = df.iloc[:-1, 4].values
cmap, norm = mpl.colors.from_levels_and_colors(levels, colors)
ticks = np.array(levels[:-1]) + np.diff(levels) / 2.0

model3.grid.data["landuse"].plot(
    ax=axes[1], cmap=cmap, norm=norm, cbar_kwargs=dict(ticks=ticks)
)
gdf_xy.plot(ax=axes[1], markersize=40, c="red", zorder=2)
axes[1].set_title("VITO Landuse")
[19]:
Text(0.5, 1.0, 'VITO Landuse')