Tip
Example: Define hydrological model regions#
The first step when building a model is to define the model domain. For hydrological models this is typically a full basin or sub-basin which includes all upstream cells. For hydrodynamic models this can also be an inter-basin which does not necessary include all upstream cells. HydroMT has the get_basin_geometry() method to do just that.
Import packages#
[1]:
import geopandas as gpd
import numpy as np
from shapely.geometry import box
[2]:
# for plotting
import cartopy.crs as ccrs
import cartopy.io.img_tiles as cimgt
import matplotlib.pyplot as plt

proj = ccrs.PlateCarree()  # plot projection
[3]:
import hydromt
import hydromt.gis.flw as flw
from hydromt import log
from hydromt.model.processes.basin_mask import get_basin_geometry

log.initialize_logging()
/home/runner/work/hydromt/hydromt/.pixi/envs/default/lib/python3.14/site-packages/tqdm/auto.py:21: TqdmWarning: IProgress not found. Please update jupyter and ipywidgets. See https://ipywidgets.readthedocs.io/en/stable/user_install.html
  from .autonotebook import tqdm as notebook_tqdm
2026-07-02 09:55:31,877 - hydromt - log - INFO - HydroMT version: 1.5.0.dev0
Read data#
Read data using the DataCatalog. If no yml files with data sources are provided, by default data for the Piave basin is downloaded from the hydromt-artifacts to to ~/.hydromt_data/. Links to the original data sources and data licenses can be found in the meta dict of each source. Here we use flow direction data from MERIT Hydro. Note that the original 'MERIT Hydro' data has
been extended with a basin mask layer, which together with the basin index vector data makes faster basin delineation possible.
[4]:
# instantiate instance of Data Catalog
data_catalog = hydromt.DataCatalog(data_libs=["artifact_data=v1.0.0"])
2026-07-02 09:55:31,897 - hydromt.data_catalog.data_catalog - data_catalog - INFO - Reading data catalog artifact_data v1.0.0
2026-07-02 09:55:31,898 - hydromt.data_catalog.data_catalog - data_catalog - INFO - Parsing data catalog from /home/runner/.hydromt/artifact_data/v1.0.0/data_catalog.yml
[5]:
# read MERIT hydro flow direction data
print(data_catalog.get_source("merit_hydro"))
ds = data_catalog.get_rasterdataset("merit_hydro")
name='merit_hydro' uri='merit_hydro/{variable}.tif' data_adapter=RasterDatasetAdapter(unit_add={}, unit_mult={}, rename={}) driver=RasterioDriver(filesystem=FSSpecFileSystem(protocol='file', storage_options={}), options=RasterioOptions(mosaic=False, mosaic_kwargs={}, cache=False, cache_root='/home/runner/.hydromt', cache_dir=None)) uri_resolver=ConventionResolver(filesystem=FSSpecFileSystem(protocol='file', storage_options={}), options={}) root='/home/runner/.hydromt/artifact_data/v1.0.0' version='1.0' provider=None metadata=SourceMetadata(crs=<Geographic 2D CRS: EPSG:4326>
Name: WGS 84
Axis Info [ellipsoidal]:
- Lat[north]: Geodetic latitude (degree)
- Lon[east]: Geodetic longitude (degree)
Area of Use:
- name: World.
- bounds: (-180.0, -90.0, 180.0, 90.0)
Datum: World Geodetic System 1984 ensemble
- Ellipsoid: WGS 84
- Prime Meridian: Greenwich
, unit=None, extent={}, nodata=None, attrs={}, category='topography', paper_doi='10.1029/2019WR024873', paper_ref='Yamazaki et al. (2019)', url='http://hydro.iis.u-tokyo.ac.jp/~yamadai/MERIT_Hydro', license='CC-BY-NC 4.0 or ODbL 1.0')
2026-07-02 09:55:32,531 - hydromt.data_catalog.sources.data_source - data_source - INFO - Reading merit_hydro RasterDataset data from /home/runner/.hydromt/artifact_data/v1.0.0/merit_hydro/{variable}.tif
[6]:
# read MERIT hydro basin index vector data. This data contains bounding box geometries of all basins globally.
# Here we pass the GeoDataFrameAdapter instead of the GeoDataFrame itself
# a spatial subset of the data loaded within the get_basin_geometry method
basin_index = data_catalog.get_source("merit_hydro_index")
print(basin_index)
name='merit_hydro_index' uri='merit_hydro_index.gpkg' data_adapter=GeoDataFrameAdapter(unit_add={}, unit_mult={}, rename={}) driver=PyogrioDriver(filesystem=FSSpecFileSystem(protocol='file', storage_options={}), options=DriverOptions()) uri_resolver=ConventionResolver(filesystem=FSSpecFileSystem(protocol='file', storage_options={}), options={}) root='/home/runner/.hydromt/artifact_data/v1.0.0' version=None provider=None metadata=SourceMetadata(crs=<Geographic 2D CRS: EPSG:4326>
Name: WGS 84
Axis Info [ellipsoidal]:
- Lat[north]: Geodetic latitude (degree)
- Lon[east]: Geodetic longitude (degree)
Area of Use:
- name: World.
- bounds: (-180.0, -90.0, 180.0, 90.0)
Datum: World Geodetic System 1984 ensemble
- Ellipsoid: WGS 84
- Prime Meridian: Greenwich
, unit=None, extent={}, nodata=None, attrs={}, category='topography', paper_doi='10.5194/hess-2020-582', paper_ref='Eilander et al. (in review)', license='CC-BY-NC 4.0')
[7]:
# derive river geometry based on stream order >= 7 (for plotting only)
flwdir = flw.flwdir_from_da(ds["flwdir"], ftype="d8")
feats = flwdir.streams(mask=ds["strord"] >= 7)
gdf_riv = gpd.GeoDataFrame.from_features(feats)


def plot(extent, gdf_bas, gdf_out):
    plt.figure(figsize=(3, 5))
    ax = plt.subplot(projection=proj)
    ax.set_extent(extent, crs=proj)
    ax.add_image(cimgt.QuadtreeTiles(), 10)
    gdf_bas.boundary.plot(ax=ax, edgecolor="k", zorder=2)
    gdf_riv.plot(ax=ax, color="blue", alpha=0.7)
    gdf_out.plot(ax=ax, markersize=40, c="red", zorder=2)
    return ax
Delineate basins#
Several examples to delineate sub-, inter- or full basins are provided below together with the command line interface (CLI) syntax for the HydroMT build command. All CLI options are described in the parse_region_basin() method.
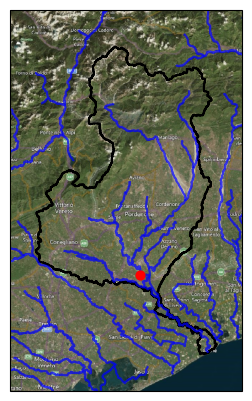
Get the basin based on a point location [x, y].
[8]:
# CLI syntax: -r {'basin': [x, y]}
# e.g.: -r {'basin': [12.6, 45.8]}

xy = [12.6, 45.8]
gdf_bas, _ = get_basin_geometry(
    ds,
    kind="basin",
    xy=xy,
    basin_index=basin_index,
)
2026-07-02 09:55:32,920 - hydromt.data_catalog.sources.data_source - data_source - INFO - Reading merit_hydro_index GeoDataFrame data from /home/runner/.hydromt/artifact_data/v1.0.0/merit_hydro_index.gpkg
2026-07-02 09:55:32,970 - hydromt.model.processes.basin_mask - basin_mask - INFO - basin bbox: [12.1958, 45.5850, 12.8983, 46.4167]
[9]:
# plot results
gdf_xy = gpd.GeoDataFrame(geometry=gpd.points_from_xy(x=[xy[0]], y=[xy[1]]), crs=4326)
extent = np.array(gdf_bas.buffer(0.1).total_bounds)[[0, 2, 1, 3]]

plot(extent, gdf_bas, gdf_xy)
[9]:
<GeoAxes: >
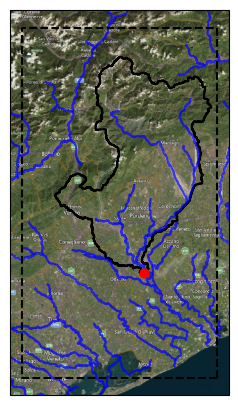
Delineate sub-basins#
We need an initial bounding box to delineate the sub-basin. This can be derived from the merit_hydro_index or user provided initial bounds. The latter might be faster if delineating a small sub-basin from a large basin. A warning is raised if not all contributing cells are included.
Get a subbasin based on its outlet location [x,y], snapped to a stream defined by a <variable>:<threshold> pair, in this case a stream order larger or equal to 7. The variable should be present in the dataset ds.
[10]:
# CLI syntax: -r {'subbasin': [x, y], <variable>: <threshold>, 'bounds': [xmin, ymin, xmax, ymax]}
# e.g.: -r {'subbasin': [12.6, 45.8], 'strord': 7, 'bounds': [12.1, 45.5, 12.9, 46.5]}

xy = [12.6, 45.8]
bounds = [12.1, 45.5, 12.9, 46.5]
gdf_bas, gdf_out = get_basin_geometry(
    ds,
    kind="subbasin",
    xy=xy,
    strord=7,
    bounds=bounds,
)
2026-07-02 09:55:35,336 - hydromt.model.processes.basin_mask - basin_mask - INFO - subbasin bbox: [12.2350, 45.7950, 12.8783, 46.4167]
[11]:
# plot results
gdf_bounds = gpd.GeoDataFrame(geometry=[box(*bounds)], crs=4326)
extent = gdf_bounds.buffer(0.05).total_bounds[[0, 2, 1, 3]]

ax = plot(extent, gdf_bas, gdf_out)
gdf_bounds.boundary.plot(ax=ax, edgecolor="k", ls="--")
[11]:
<GeoAxes: >
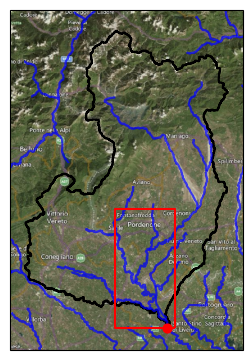
Get a sub-basin based on the location where the stream flows out of a bbox. Here the stream defined by a <variable>:<threshold> pair, in this case a stream order larger or equal to 8. The variable should be present in the dataset ds.
[12]:
# CLI SYNTAX: -r {'subbasin': [xmin, ymin, xmax, ymax], <variable>: <threshold>}
# e.g.: -r {'subbasin': [12.50, 45.72, 12.7, 46], 'strord': 8}

bbox = [12.50, 45.72, 12.7, 46]
gdf_bas, gdf_out = get_basin_geometry(
    ds,
    kind="subbasin",
    bbox=bbox,
    strord=8,
    basin_index=basin_index,
)
2026-07-02 09:55:36,399 - hydromt.data_catalog.sources.data_source - data_source - INFO - Reading merit_hydro_index GeoDataFrame data from /home/runner/.hydromt/artifact_data/v1.0.0/merit_hydro_index.gpkg
2026-07-02 09:55:36,607 - hydromt.model.processes.basin_mask - basin_mask - INFO - subbasin bbox: [12.1958, 45.7192, 12.8783, 46.4167]
[13]:
# plot results
gdf_bbox = gpd.GeoDataFrame(geometry=[box(*bbox)], crs=4326)
extent = gdf_bas.buffer(0.05).total_bounds[[0, 2, 1, 3]]

ax = plot(extent, gdf_bas, gdf_out)
gdf_bbox.boundary.plot(ax=ax, edgecolor="r", ls="-")
[13]:
<GeoAxes: >
Delineate interbasins#
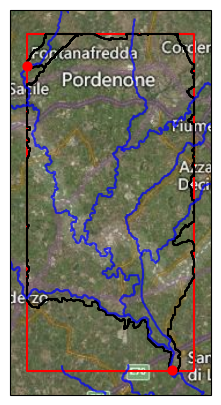
Get an inter-basin based on the streams within a bbox. The inter-basin is limited to the most downstream contiguous area within the bbox that drains to the stream. Here the stream defined by a <variable>:<threshold> pair, in this case a stream order larger or equal to 8. The variable should be present in the dataset ds. The buffer is required to check wether streams flow in and out of the bbox.
[14]:
# CLI SYNTAX -r {'interbasin': [xmin, ymin, xmax, ymax], <variable>: <threshold>}
# e.g.: -r {'interbasin': [12.50, 45.72, 12.7, 46], 'strord': 8}

bbox = [12.50, 45.72, 12.7, 46]
gdf_bas, gdf_out = get_basin_geometry(
    ds,
    kind="interbasin",
    bbox=bbox,
    strord=8,
    buffer=20,
)
2026-07-02 09:55:39,979 - hydromt.model.processes.basin_mask - basin_mask - INFO - interbasin bbox: [12.5000, 45.7200, 12.7000, 46.0000]
[15]:
# plot results
gdf_bbox = gpd.GeoDataFrame(geometry=[box(*bbox)], crs=4326)
extent = gdf_bbox.buffer(0.02).total_bounds[[0, 2, 1, 3]]

ax = plot(extent, gdf_bas, gdf_out)
gdf_bbox.boundary.plot(ax=ax, edgecolor="r", ls="-", zorder=1)
[15]:
<GeoAxes: >