Network from shapefile#
This tutorial shows how to create a road network from a shapefile using RA2CE. You can use this workflow when you already have a geospatial dataset (instead of downloading from OpenStreetMap).
Note: Make sure your shapefile contains valid road geometries (e.g.
LineString) and that it is projected in a suitable CRS (e.g. UTM). For more information on projections, see the CRS documentation.
Step 1. Import the Required Packages#
[ ]:
from pathlib import Path
import geopandas as gpd
import matplotlib.pyplot as plt

from ra2ce.network.network_config_data.network_config_data import (
    NetworkSection, NetworkConfigData
)
from ra2ce.network.network_config_data.enums.source_enum import SourceEnum
from ra2ce.ra2ce_handler import Ra2ceHandler
Step 2. Define Paths and Network Configuration#
Indicate the path to the root directory of your project and to the network shapefile. We recommend to follow the structure shown in the Getting Started Guide.
As a user, define the network configuration using the NetworkConfigData and NetworkSection classes.
[ ]:
root_dir = Path("data", "network_from_shapefile")
network_path = root_dir / "network"

network_section = NetworkSection(
    source=SourceEnum.SHAPEFILE,
    primary_file=network_path.joinpath("base_shapefile.shp"),
    save_gpkg=True,
)

network_config_data = NetworkConfigData(
    root_path=root_dir,
    static_path=root_dir.joinpath("static"),
    network=network_section,
)
Step 3. Initialize and Configure RA2CE#
Running the configure method from the Ra2ceHandler will generate the network and store the results in the static/output_graph folder.
[ ]:
handler = Ra2ceHandler.from_config(network=network_config_data, analysis=None)
handler.configure()
Step 4. Load and Inspect the Output#
A few geopackages are created in the static/output_graph folder, you can load and inspect them using geopandas.
[ ]:
path_output_graph = root_dir / "static" / "output_graph"
base_graph_edges = path_output_graph / "base_graph_edges.gpkg"
edges_gdf = gpd.read_file(base_graph_edges, driver = "GPKG")

base_graph_nodes = path_output_graph / "base_graph_nodes.gpkg" #specify where to find the nodes file
nodes_gdf = gpd.read_file(base_graph_nodes, driver = "GPKG") #read in the nodes file
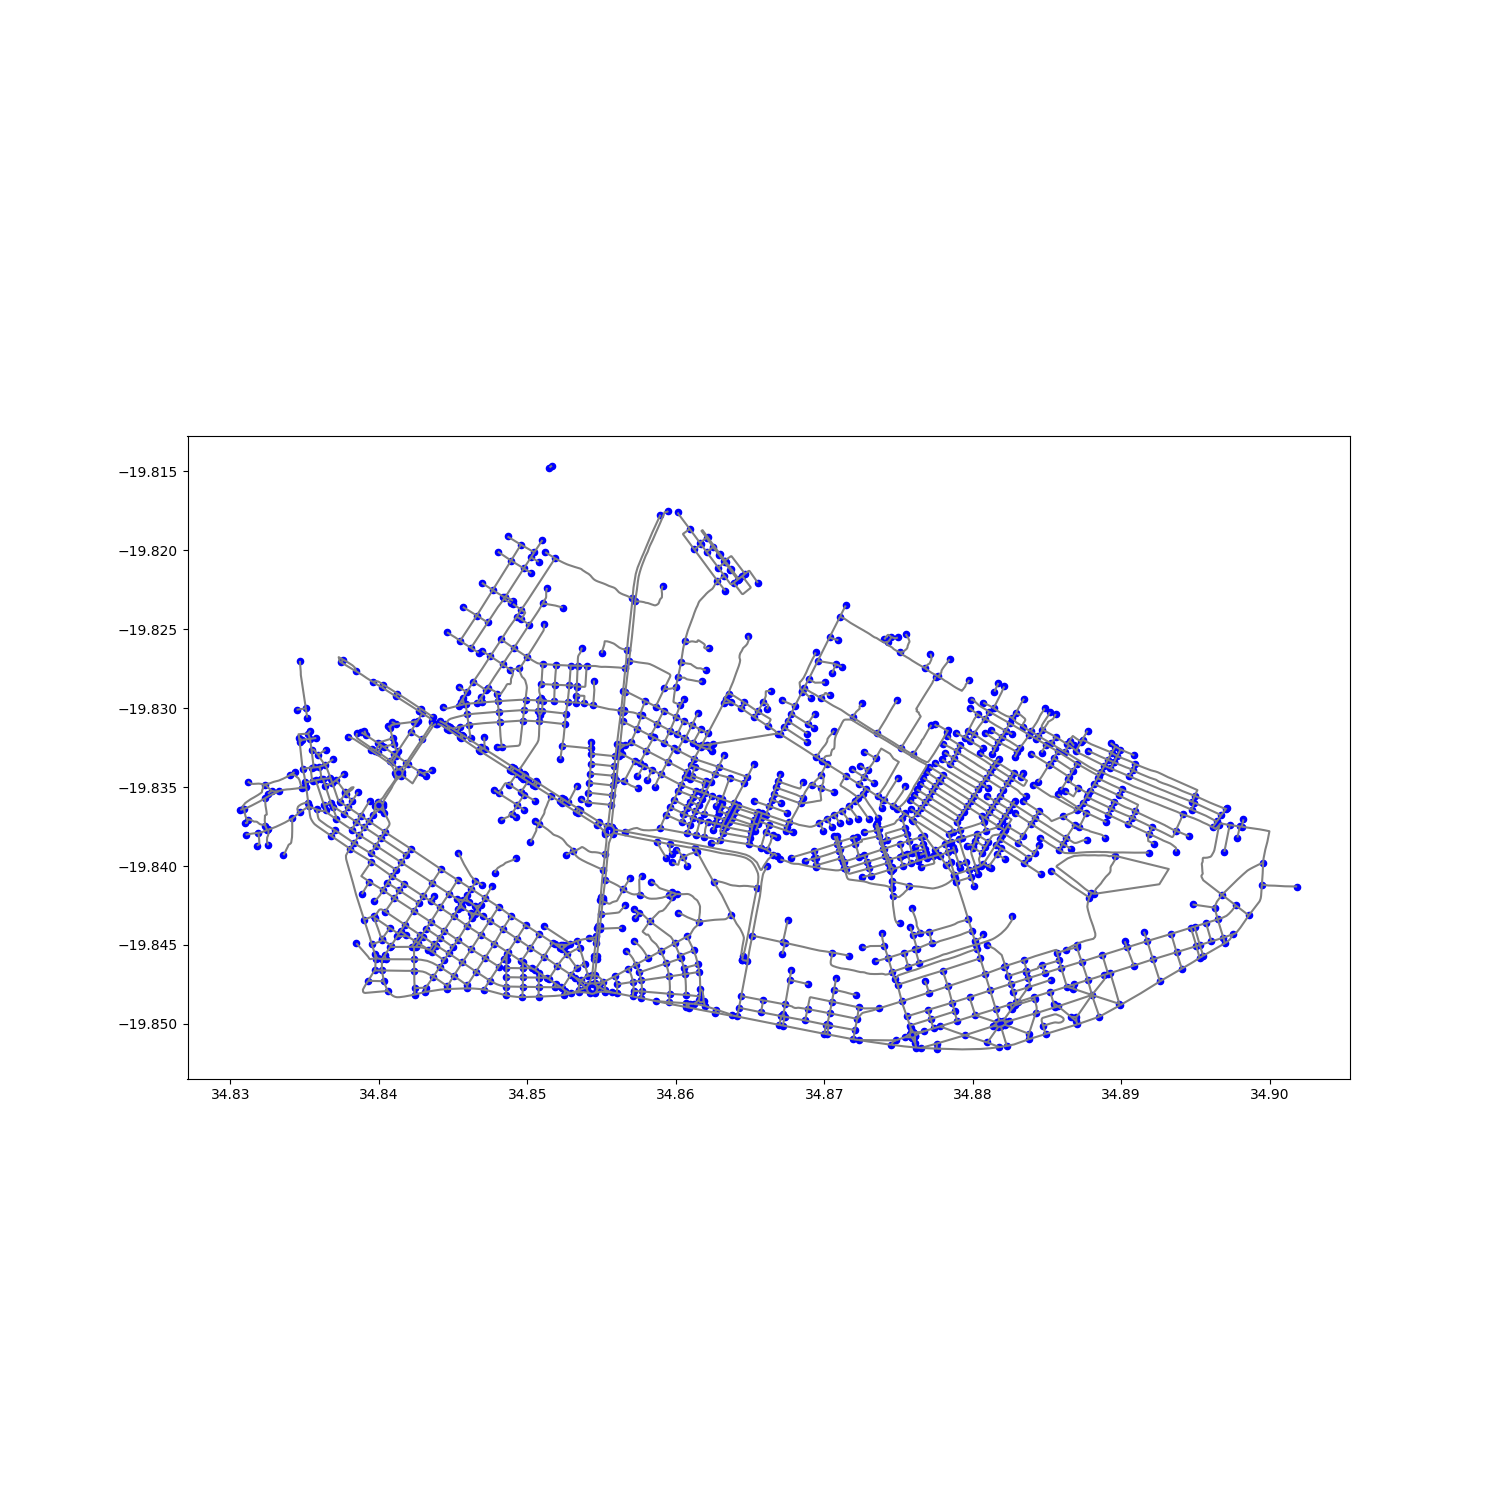
Step 5. Plot Nodes and Edges#
[ ]:
fig, ax = plt.subplots(figsize=(15, 15))

# Plot edges first
baseplot = edges_gdf.plot(ax=ax, color="grey")

# Overlay nodes
nodes_gdf.plot(ax=baseplot, color="blue", markersize=20)

plt.show()