Single Link Redundancy Tutorial#
π What happens if one road is blocked?#
In this tutorial, you will learn how to run a single link redundancy analysis with RA2CE. This type of analysis checks what happens if one road segment (also called a link) becomes unavailable:
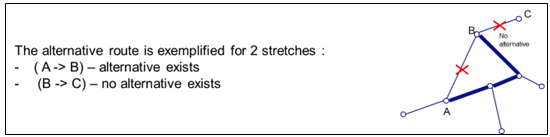
Is there another way to get around?
How much longer is the detour compared to the original route?
Which roads have no backup options at all?
Note: This example does not require hazard maps, but you do need a prepared network. If you are new to networks in RA2CE, first go through the
network
tutorial.
The redundancy of each link is expressed in the total distance (weighing) for the alternative route (weighing = distance). Below is a complete Python example demonstrating how to run a single link redundancy analysis with RA2CE.
Step 1: Import Libraries and Set Paths#
We start by importing the required libraries and defining the root directory and network path.
[1]:
from pathlib import Path
import geopandas as gpd
from ra2ce.analysis.analysis_config_data.analysis_config_data import AnalysisSectionLosses, AnalysisConfigData
from ra2ce.analysis.analysis_config_data.enums.analysis_losses_enum import AnalysisLossesEnum
from ra2ce.analysis.analysis_config_data.enums.weighing_enum import WeighingEnum
from ra2ce.network.network_config_data.network_config_data import NetworkSection, NetworkConfigData
from ra2ce.network.network_config_data.enums.source_enum import SourceEnum
from ra2ce.ra2ce_handler import Ra2ceHandler
root_dir = Path('data', 'single_link_redundancy')
network_path = root_dir / "network"
c:\Users\hauth\miniforge3\envs\ra2ce_env\Lib\site-packages\tqdm\auto.py:21: TqdmWarning: IProgress not found. Please update jupyter and ipywidgets. See https://ipywidgets.readthedocs.io/en/stable/user_install.html
from .autonotebook import tqdm as notebook_tqdm
Step 2: Define Network and Analysis Configuration#
[3]:
# Define the network section
network_section = NetworkSection(
source=SourceEnum.SHAPEFILE,
primary_file=network_path.joinpath("base_shapefile.shp"),
save_gpkg=True
)
# Build the full configuration
network_config_data = NetworkConfigData(
root_path=root_dir,
static_path=root_dir.joinpath('static'),
network=network_section,
)
Next, we define the AnalysisSectionLosses and AnalysisConfigData sections of the configuration. We select the analysis type as AnalysisLossesEnum.SINGLE_LINK_REDUNDANCY and the weighing method as WeighingEnum.LENGTH. We also specify that we want to save the results in both CSV and GPKG formats.
Try:
AnalysisLossesEnum.SINGLE_LINK_REDUNDANCY
[4]:
analyse_section = AnalysisSectionLosses(
name="tutorial_single_link_redundancy",
analysis=AnalysisLossesEnum.SINGLE_LINK_REDUNDANCY,
weighing=WeighingEnum.LENGTH,
save_csv=True,
save_gpkg=True,
)
analysis_config_data = AnalysisConfigData(
output_path=root_dir.joinpath("output"),
static_path=root_dir.joinpath('static'),
analyses=[analyse_section],
)
Running the Ra2ceHandler.configure
method from the Ra2ceHandler
will generate both the base network and the overlaid network, and will store these results in the static/output_graph
folder.
[5]:
handler = Ra2ceHandler.from_config(network=network_config_data, analysis=analysis_config_data)
handler.configure()
handler.run_analysis()
100%|ββββββββββ| 4217/4217 [00:00<00:00, 450909.60it/s]
2025-10-02 10:21:57 AM - [avg_speed_calculator.py:175] - root - WARNING - No valid file found with average speeds data\single_link_redundancy\static\output_graph\avg_speed.csv, calculating and saving them instead.
2025-10-02 10:21:57 AM - [avg_speed_calculator.py:150] - root - WARNING - Default speed have been assigned to road type [<RoadTypeEnum.SECONDARY_LINK: 8>]. Please check the average speed CSV, enter the right average speed for this road type and run RA2CE again.
2025-10-02 10:21:57 AM - [avg_speed_calculator.py:150] - root - WARNING - Default speed have been assigned to road type [<RoadTypeEnum.SECONDARY: 7>]. Please check the average speed CSV, enter the right average speed for this road type and run RA2CE again.
c:\Users\hauth\miniforge3\envs\ra2ce_env\Lib\site-packages\fiona\collection.py:165: FeatureWarning: Empty field name at index 4
self.session.start(self, **kwargs)
c:\Users\hauth\miniforge3\envs\ra2ce_env\Lib\site-packages\fiona\collection.py:165: FeatureWarning: Empty field name at index 1
self.session.start(self, **kwargs)
c:\Users\hauth\miniforge3\envs\ra2ce_env\Lib\site-packages\fiona\collection.py:165: FeatureWarning: Empty field name at index 4
self.session.start(self, **kwargs)
[5]:
[AnalysisResultWrapper(results_collection=[AnalysisResult(analysis_result= link_id highway avgspeed \
u v key
0 1 0 None None tertiary 60.0
2 0 None None tertiary 58.0
3 0 None None tertiary 58.0
1 465 0 None None tertiary 60.0
663 0 None None residential 60.0
... ... ... ... ...
1481 1482 0 None None residential 60.0
1483 0 None None residential 60.0
1484 0 None None residential 60.0
1508 1512 0 None None residential 60.0
1513 1514 0 None None residential 60.0
geometry lanes \
u v key
0 1 0 LINESTRING (34.87673 -19.85047, 34.87737 -19.8... nan
2 0 LINESTRING (34.87673 -19.85047, 34.87642 -19.8... nan
3 0 LINESTRING (34.87606 -19.85055, 34.87628 -19.8... nan
1 465 0 LINESTRING (34.87780 -19.85016, 34.87737 -19.8... nan
663 0 LINESTRING (34.87717 -19.84969, 34.87737 -19.8... nan
... ... ...
1481 1482 0 LINESTRING (34.85976 -19.83977, 34.86006 -19.8... nan
1483 0 LINESTRING (34.86077 -19.84001, 34.86071 -19.8... nan
1484 0 LINESTRING (34.86003 -19.83896, 34.86014 -19.8... nan
1508 1512 0 LINESTRING (34.88623 -19.83527, 34.88641 -19.8... nan
1513 1514 0 LINESTRING (34.85359 -19.83575, 34.85383 -19.8... nan
length maxspeed bridge node_A node_B edge_fid rfid_c rfid \
u v key
0 1 0 70.0 60 nan 0 1 0_1 1 4
2 0 70.0 nan nan 0 2 0_2 2 7
3 0 71.0 nan nan 0 3 0_3 3 10
1 465 0 47.0 60 nan 1 465 1_465 4 1470
663 0 69.0 nan nan 1 663 1_663 5 2066
... ... ... ... ... ... ... ... ...
1481 1482 0 113.0 nan nan 1481 1482 1481_1482 2117 4175
1483 0 68.0 nan nan 1481 1483 1481_1483 2118 4176
1484 0 78.0 nan nan 1481 1484 1481_1484 2119 4177
1508 1512 0 139.0 nan nan 1508 1512 1508_1512 2120 4209
1513 1514 0 55.0 nan nan 1513 1514 1513_1514 2121 4213
time alt_length alt_nodes diff_length \
u v key
0 1 0 0.001 352.0 [0, 3, 14, 19, 20, 663, 1] 282.0
2 0 0.001 95.0 [0, 3, 2] 25.0
3 0 0.001 94.0 [0, 2, 3] 23.0
1 465 0 0.001 441.0 [1, 663, 661, 447, 465] 394.0
663 0 0.001 353.0 [1, 0, 3, 14, 19, 20, 663] 284.0
... ... ... ... ...
1481 1482 0 0.002 NaN nan NaN
1483 0 0.001 NaN nan NaN
1484 0 0.001 NaN nan NaN
1508 1512 0 0.002 NaN nan NaN
1513 1514 0 0.001 NaN nan NaN
detour
u v key
0 1 0 1
2 0 1
3 0 1
1 465 0 1
663 0 1
... ...
1481 1482 0 0
1483 0 0
1484 0 0
1508 1512 0 0
1513 1514 0 0
[2109 rows x 19 columns], analysis_config=AnalysisSectionLosses(name='tutorial_single_link_redundancy', save_gpkg=True, save_csv=True, analysis=<AnalysisLossesEnum.SINGLE_LINK_REDUNDANCY: 1>, weighing=<WeighingEnum.LENGTH: 1>, production_loss_per_capita_per_hour=nan, traffic_period=<TrafficPeriodEnum.DAY: 1>, hours_per_traffic_period=0, trip_purposes=[<TripPurposeEnum.NONE: 0>], resilience_curves_file=None, traffic_intensities_file=None, values_of_time_file=None, threshold=0.0, threshold_destinations=nan, equity_weight='', calculate_route_without_disruption=False, buffer_meters=nan, category_field_name='', save_traffic=False, event_type=<EventTypeEnum.NONE: 0>, risk_calculation_mode=<RiskCalculationModeEnum.NONE: 0>, risk_calculation_year=0), output_path=WindowsPath('data/single_link_redundancy/output'), _custom_name='')])]
Step 3: Inspect results#
The results are stored in the folder output
within the root directory. The results include a CSV file and a GPKG file containing the redundancy analysis results for each link in the network.
[6]:
analysis_output_folder = root_dir.joinpath("output", "single_link_redundancy")
redundancy_gdf = gpd.read_file(analysis_output_folder/"tutorial_single_link_redundancy.gpkg")
redundancy_gdf.head()
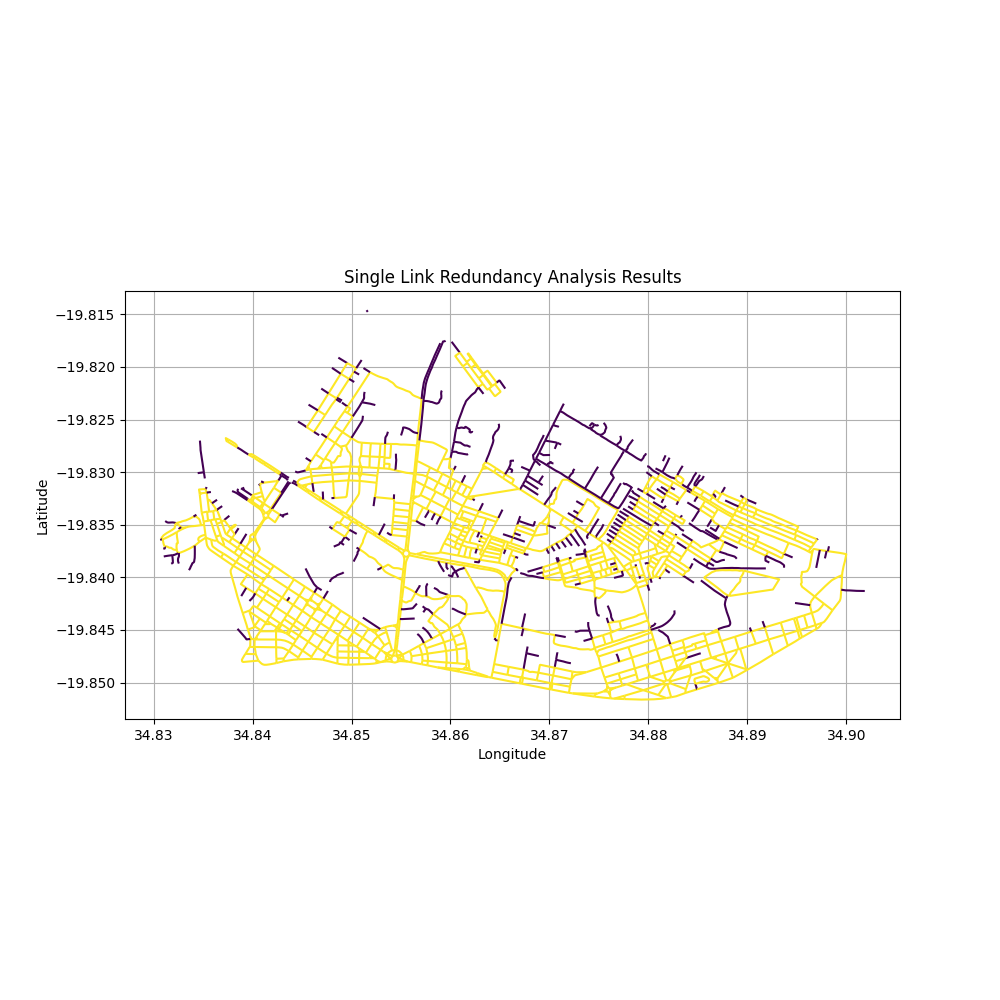
c:\Users\hauth\miniforge3\envs\ra2ce_env\Lib\site-packages\fiona\collection.py:208: FeatureWarning: Empty field name at index 4
self._schema = self.session.get_schema()
c:\Users\hauth\miniforge3\envs\ra2ce_env\Lib\site-packages\geopandas\geodataframe.py:639: UserWarning: Empty field name at index 4
for feature in features_lst:
[6]:
u | v | key | link_id | highway | avgspeed | lanes | length | maxspeed | ... | node_B | edge_fid | rfid_c | rfid | time | alt_length | alt_nodes | diff_length | detour | geometry | ||
---|---|---|---|---|---|---|---|---|---|---|---|---|---|---|---|---|---|---|---|---|---|
0 | 0 | 1 | 0 | None | None | tertiary | 60.0 | nan | 70.0 | 60 | ... | 1 | 0_1 | 1 | 4 | 0.001 | 352.0 | [0, 3, 14, 19, 20, 663, 1] | 282.0 | 1 | LINESTRING (34.87673 -19.85047, 34.87737 -19.8... |
1 | 0 | 2 | 0 | None | None | tertiary | 58.0 | nan | 70.0 | nan | ... | 2 | 0_2 | 2 | 7 | 0.001 | 95.0 | [0, 3, 2] | 25.0 | 1 | LINESTRING (34.87673 -19.85047, 34.87642 -19.8... |
2 | 0 | 3 | 0 | None | None | tertiary | 58.0 | nan | 71.0 | nan | ... | 3 | 0_3 | 3 | 10 | 0.001 | 94.0 | [0, 2, 3] | 23.0 | 1 | LINESTRING (34.87606 -19.85055, 34.87628 -19.8... |
3 | 1 | 465 | 0 | None | None | tertiary | 60.0 | nan | 47.0 | 60 | ... | 465 | 1_465 | 4 | 1470 | 0.001 | 441.0 | [1, 663, 661, 447, 465] | 394.0 | 1 | LINESTRING (34.87780 -19.85016, 34.87737 -19.8... |
4 | 1 | 663 | 0 | None | None | residential | 60.0 | nan | 69.0 | nan | ... | 663 | 1_663 | 5 | 2066 | 0.001 | 353.0 | [1, 0, 3, 14, 19, 20, 663] | 284.0 | 1 | LINESTRING (34.87717 -19.84969, 34.87737 -19.8... |
5 rows Γ 22 columns
Detour Availability#
RA2CE marks whether each road segment has a detour:
0
= no detour available (critical!)1
= detour available
This is stored in the detour
column.
[7]:
import matplotlib.pyplot as plt
fig, ax = plt.subplots(figsize=(10, 10))
redundancy_gdf.plot(column='detour', ax=ax, legend=False, cmap='viridis')
plt.title('Single Link Redundancy Analysis Results')
plt.xlabel('Longitude')
plt.ylabel('Latitude')
plt.grid(True)
plt.show()

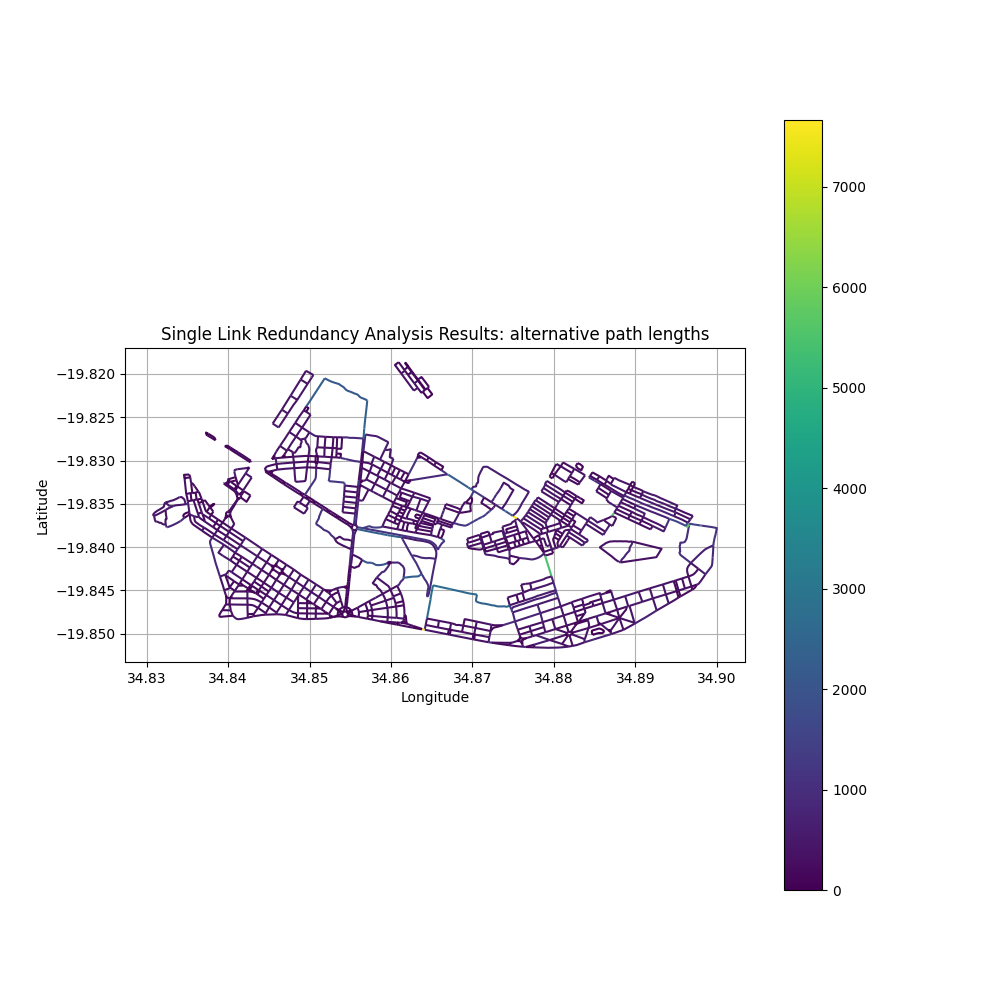
Alternative route distance#
We can now check the lengths of the alternative distance for each link in the network with the attribute alt_dist
. The alternative distance refers to the length of the detour for when the link itself is not available.
[8]:
fig, ax = plt.subplots(figsize=(10, 10))
redundancy_gdf.plot(column='alt_length', ax=ax, legend=False, cmap='viridis')
plt.title('Single Link Redundancy Analysis Results')
plt.xlabel('Longitude')
plt.ylabel('Latitude')
plt.grid(True)
plt.show()

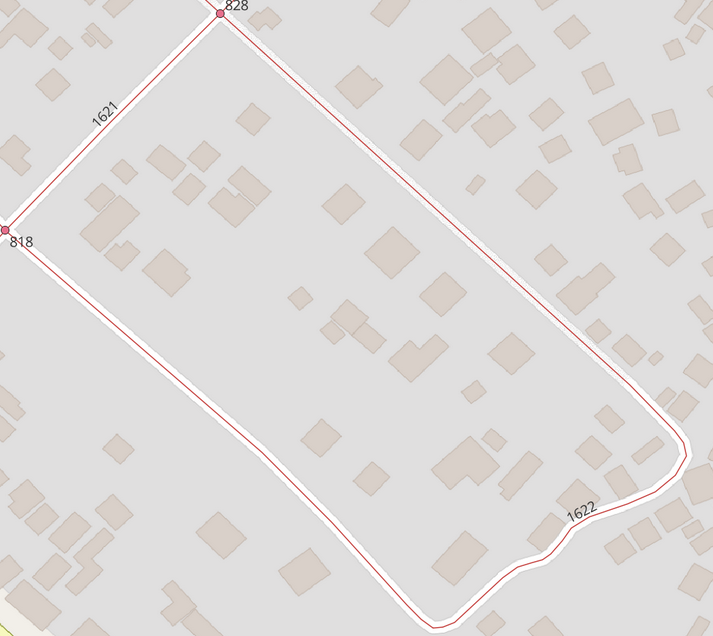
It should be noted that there are cases where the original distance can be longer than the alternative distance. In the example below, from A (818) to B (828) the alternative distance between nodes 818 and 828 (road 1621) is shorter than the length of road nr. 1622. Therefore, the diff_dist
attribute contains a negative value. The original link is longer than the alternative route! This is purely relevant from a network inspection point of view. In reality, most people will take road 1621 to
get from A to B (if that road segment is available).