Vulnerability data
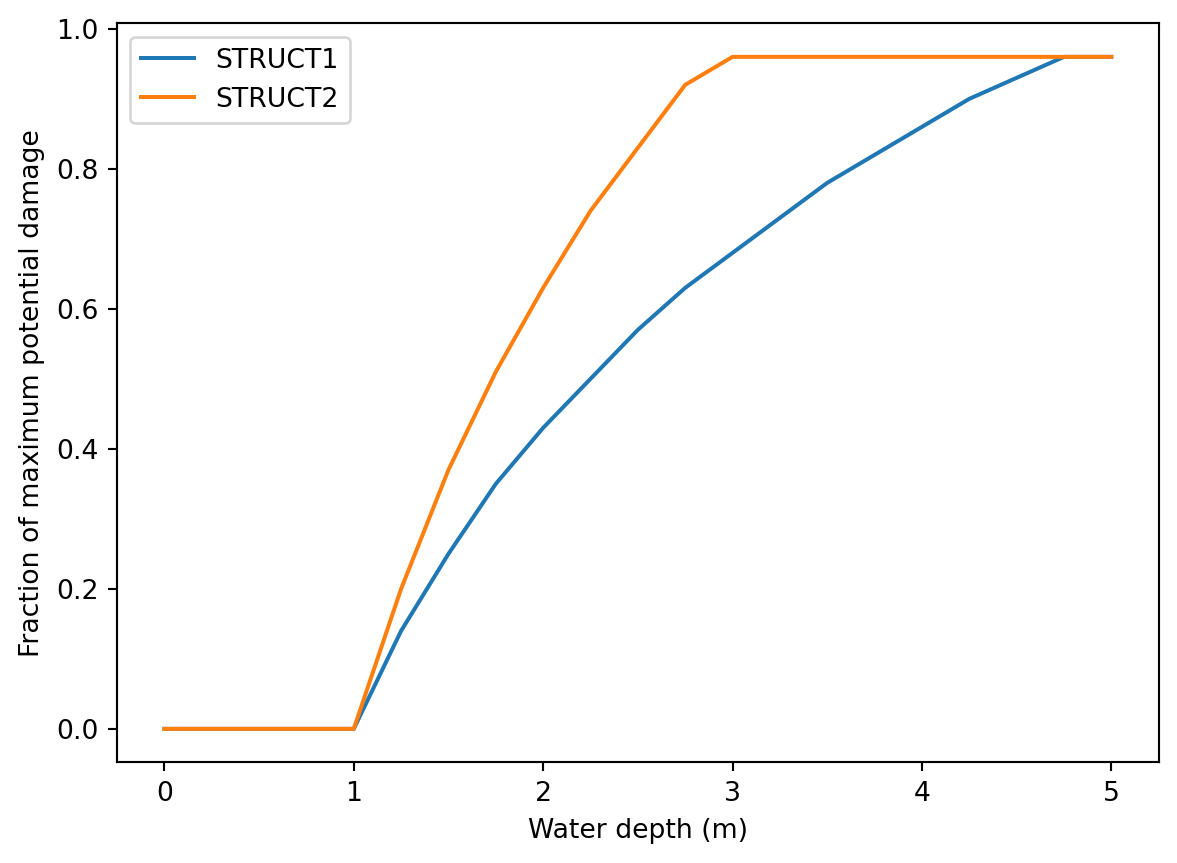
The vulnerability of an asset is determined by its building type (e.g. ‘residential 1-story building’) and the inundation depth, also refered to as water depth, during a flood event. Different assests incur different degrees of damage at varying inundation levels. This vulnerability can be quantified via flood depth-damage functions, see for example Figure 1. The damage function relates the water depth to the maximum potential damage per asset and returns the damage fraction (a value between 0 and 1). The damage fraction is multiplied by the maximum potential damage to obtain a damage value. The value of the maximum potential damage differs per asset and must be specified in the exposure data.
The damage functions must be given in a CSV file (vulnerability.csv), located in the vulnerability folder, see for example Table 1. The first column contains the water depth, and then each additional column provides the damage fraction for the corresponding damage function. Three header rows are required, describing the unit of the water depth; #UNIT=<unit>, e.g., #UNIT=m. The second row, named #METHOD, must be defined for each damage-curve separately above the damage curve name. The method refers to the way that multiple flood values will be aggregated per asset in case the area method is used for deriving the inundation depth. The damage curve name must coincide with the name of the damage function defined in the exposure data.
Important
Water depth units (e.g. feet or meters) must be consistent with the units of the flood hazard map and the exposure data (i.e., ground elevation, ground floor height).
| #UNIT=m | ||
|---|---|---|
| #METHOD | mean | max |
| water depth | STRUCT1 | STRUCT2 |
| 0.00 | 0.00 | 0.00 |
| 0.25 | 0.00 | 0.00 |
| 0.50 | 0.00 | 0.00 |
| 0.75 | 0.00 | 0.00 |
| 1.00 | 0.00 | 0.00 |
| 1.25 | 0.14 | 0.20 |
| 1.50 | 0.25 | 0.37 |
| 1.75 | 0.35 | 0.51 |
| 2.00 | 0.43 | 0.63 |
| 2.25 | 0.50 | 0.74 |
| 2.50 | 0.57 | 0.83 |
| 2.75 | 0.63 | 0.92 |
| 3.00 | 0.68 | 0.96 |
| 3.25 | 0.73 | 0.96 |
| 3.50 | 0.78 | 0.96 |
| 3.75 | 0.82 | 0.96 |
| 4.00 | 0.86 | 0.96 |
| 4.25 | 0.90 | 0.96 |
| 4.50 | 0.93 | 0.96 |
| 4.75 | 0.96 | 0.96 |
| 5.00 | 0.96 | 0.96 |
Water depths may be negative for assets that incur damage below the ground floor height, and the user is free to choose any water depth increments in the CSV file. The damage functions can have any name. Multiple damage-functions can be described in the vulnerability curves CSV file by simply adding consecutive columns next to one another.
Tip
You can also create damage functions with the HydroMT-FIAT model builder