Tip
Update monitoring locations#
Once you have a DELWAQ model, you may want to update your model in order to add new emission data, add sample locations, use different hydrological forcing data, create and run different scenarios etc.
With HydroMT, you can easily read your model and update one or several components of your model using the update function of the command line interface (CLI). Here are the steps and some examples on how to update monitoring points and areas to your model.
All lines in this notebook which starts with ! are executed from the command line. Within the notebook environment the logging messages are shown after completion. You can also copy these lines and paste them in your shell to get more feedback.
Import packages#
In this notebook, we will use some functions of HydroMT to plot the new monitoring points of the updated model. Here are the libraries to import to realize these steps.
[1]:
import numpy as np
[2]:
# for plotting
import matplotlib.pyplot as plt
import cartopy.io.img_tiles as cimgt
import cartopy.crs as ccrs
proj = ccrs.PlateCarree() # plot projection
[3]:
# import hydromt
import hydromt
from hydromt_delwaq import DelwaqModel, DemissionModel
/home/runner/miniconda3/envs/hydromt_delwaq/lib/python3.11/site-packages/tqdm/auto.py:21: TqdmWarning: IProgress not found. Please update jupyter and ipywidgets. See https://ipywidgets.readthedocs.io/en/stable/user_install.html
  from .autonotebook import tqdm as notebook_tqdm
Locations of the monitoring points#
Adding monitoring points to your DELWAQ model can be quite useful. It allows you to directly extract model outputs at specific locations. For example for model validation, calibration, you can then directly compare model results to available observations.
In our previous notebook, we built a DELWAQ model in which the locations of the Wflow basin outlets area added (from the staticgeoms/gauges.geojson). If you have other observation data available, you can easily add them to your model using HydroMT. One way to do it is to prepare a csv table containing the ID, latitude and longitude of the available stations. An example examples_data/test_monpoints.csv has been prepared. Let’s have a look at it.
[4]:
fn_station = 'examples_data/test_monpoints.csv'
with open(fn_station, 'r', encoding='utf8') as f:
    txt = f.read()
print(txt)
ID,Name,x,y
1001,Gauge1,11.9594,45.8925
1002,Gauge2,12.3395,46.1492
1003,Gauge3,12.0785,46.1122
Here we can see that we have defined three stations with an ID and the longitude (x) and latitude (y) coordinates, in the same EPSG system as our model (EPSG 4326). We can now add them to our model.
HydroMT CLI update interface#
Using the hydroMT update API, we can update one or several components of an already existing DELWAQ model. Let’s get an overview of the available options:
[5]:
# Print the options available from the update command
! hydromt update --help
Usage: hydromt update [OPTIONS] MODEL MODEL_ROOT

  Update a specific component of a model.

  Set an output directory to copy the edited model to a new folder, otherwise
  maps are overwritten.

  Example usage: --------------

  Update Wflow model components outlined in an .yml configuration file and
  write the model to a directory: hydromt update wflow_sbm /path/to/model_root
  -o /path/to/model_out  -i /path/to/wflow_config.yml  -d
  /path/to/data_catalog.yml -v

Options:
  -o, --model-out DIRECTORY  Output model folder. Maps in MODEL_ROOT are
                             overwritten if left empty.
  -i, --config PATH          Path to hydroMT configuration file, for the model
                             specific implementation.  [required]
  -d, --data TEXT            Path to local yaml data catalog file OR name of
                             predefined data catalog.
  --dd, --deltares-data      Flag: Shortcut to add the "deltares_data" catalog
  --fo, --force-overwrite    Flag: If provided overwrite existing model files
  --cache                    Flag: If provided cache tiled rasterdatasets
  -q, --quiet                Decrease verbosity.
  -v, --verbose              Increase verbosity.
  --help                     Show this message and exit.
Update Delwaq monitoring points#
Let’s prepare a HydroMT configuration file with new our options for monitoring points and areas. All available options are available in the docs(setup_monitoring).
[6]:
%%writefile delwaq_update_monitoring.yml

steps:
  - setup_monitoring:
      mon_points: "examples_data/test_monpoints.csv"
      mon_areas: subcatch
Writing delwaq_update_monitoring.yml
[7]:
# NOTE: copy this line (without !) to your shell for more direct feedback
! hydromt update delwaq WQ_piave -o ./WQ_piave_monitoring -i delwaq_update_monitoring.yml --fo -vv
2026-06-03 13:53:25,908 - hydromt - log - INFO - HydroMT version: 1.4.0
2026-06-03 13:53:25,931 - hydromt.model.model - model - INFO - Initializing delwaq model from hydromt_delwaq (v0.4.0.dev0).
2026-06-03 13:53:25,931 - hydromt - log - DEBUG - Appending log messages to file /home/runner/work/hydromt_delwaq/hydromt_delwaq/docs/_examples/WQ_piave/hydromt.log.
2026-06-03 13:53:25,931 - hydromt - log - INFO - HydroMT version: 1.4.0
2026-06-03 13:53:25,932 - hydromt.model.components.config - config - WARNING - No default model config was found at /home/runner/work/hydromt_delwaq/hydromt_delwaq/docs/_examples/WQ_piave/None. It wil be initialized as empty dictionary
2026-06-03 13:53:26,058 - hydromt.model.components.geoms - geoms - DEBUG - Reading model file basins at /home/runner/work/hydromt_delwaq/hydromt_delwaq/docs/_examples/WQ_piave/geoms/basins.geojson.
2026-06-03 13:53:26,066 - hydromt.model.components.geoms - geoms - DEBUG - Reading model file monareas at /home/runner/work/hydromt_delwaq/hydromt_delwaq/docs/_examples/WQ_piave/geoms/monareas.geojson.
2026-06-03 13:53:26,071 - hydromt.model.components.geoms - geoms - DEBUG - Reading model file monpoints at /home/runner/work/hydromt_delwaq/hydromt_delwaq/docs/_examples/WQ_piave/geoms/monpoints.geojson.
2026-06-03 13:53:26,083 - hydromt - log - DEBUG - Appending log messages to file /home/runner/work/hydromt_delwaq/hydromt_delwaq/docs/_examples/WQ_piave_monitoring/hydromt.log.
2026-06-03 13:53:26,085 - hydromt.model.model - model - INFO - update: setup_monitoring
2026-06-03 13:53:26,085 - hydromt.model.model - model - INFO - setup_monitoring.mon_points=/home/runner/work/hydromt_delwaq/hydromt_delwaq/docs/_examples/examples_data/test_monpoints.csv
2026-06-03 13:53:26,085 - hydromt.model.model - model - INFO - setup_monitoring.mon_areas=subcatch
2026-06-03 13:53:26,085 - hydromt.hydromt_delwaq.delwaq - delwaq - INFO - Setting monitoring points and areas
2026-06-03 13:53:26,085 - hydromt.hydromt_delwaq.delwaq - delwaq - INFO - Reading monitoring points from /home/runner/work/hydromt_delwaq/hydromt_delwaq/docs/_examples/examples_data/test_monpoints.csv
2026-06-03 13:53:26,100 - hydromt.data_catalog.drivers.base_driver - base_driver - DEBUG - loaded GeoDataFrameDriver plugins: dataset_xarray, geodataframe_table, geodataset_vector, geodataset_xarray, pandas, pyogrio, raster_xarray, rasterio, slippy_tile
2026-06-03 13:53:26,101 - hydromt.data_catalog.sources.data_source - data_source - INFO - Reading test_monpoints.csv GeoDataFrame data from /home/runner/work/hydromt_delwaq/hydromt_delwaq/docs/_examples/examples_data/test_monpoints.csv
2026-06-03 13:53:26,101 - hydromt.data_catalog.uri_resolvers.convention_resolver - convention_resolver - DEBUG - attempting to resolve uri: /home/runner/work/hydromt_delwaq/hydromt_delwaq/docs/_examples/examples_data/test_monpoints.csv
2026-06-03 13:53:26,104 - hydromt._utils.unused_kwargs - unused_kwargs - DEBUG - object: GeoDataFrameTableDriver does not use kwarg mask with value    value                                           geometry
0    1.0  POLYGON ((12.44167 46.69167, 12.44167 46.675, ....
2026-06-03 13:53:26,108 - hydromt.data_catalog.adapters.geodataframe - geodataframe - DEBUG - Clip intersects [11.775, 45.808, 12.742, 46.692] (EPSG:4326)
2026-06-03 13:53:26,116 - hydromt.model.components.grid - grid - WARNING - Replacing grid map: monpoints
2026-06-03 13:53:26,118 - hydromt.model.components.geoms - geoms - WARNING - Replacing geom: monpoints
2026-06-03 13:53:26,127 - hydromt.model.components.grid - grid - WARNING - Replacing grid map: monareas
2026-06-03 13:53:26,143 - hydromt.model.components.geoms - geoms - WARNING - Replacing geom: monareas
2026-06-03 13:53:26,146 - hydromt.hydromt_delwaq.delwaq - delwaq - INFO - Write model data to /home/runner/work/hydromt_delwaq/hydromt_delwaq/docs/_examples/WQ_piave_monitoring
2026-06-03 13:53:26,168 - hydromt.hydromt_delwaq.components.staticdata - staticdata - INFO - Writing staticdata files.
2026-06-03 13:53:26,193 - hydromt.hydromt_delwaq.components.hydromaps - hydromaps - INFO - Writing hydromap files.
2026-06-03 13:53:26,299 - hydromt.model.components.geoms - geoms - INFO - delwaq.geoms: Writing geoms to /home/runner/work/hydromt_delwaq/hydromt_delwaq/docs/_examples/WQ_piave_monitoring/geoms/basins.geojson.
2026-06-03 13:53:26,299 - hydromt.model.components.geoms - geoms - DEBUG - Writing geom basins with precision 6 decimals.
2026-06-03 13:53:26,303 - hydromt.model.components.geoms - geoms - INFO - delwaq.geoms: Writing geoms to /home/runner/work/hydromt_delwaq/hydromt_delwaq/docs/_examples/WQ_piave_monitoring/geoms/monareas.geojson.
2026-06-03 13:53:26,303 - hydromt.model.components.geoms - geoms - DEBUG - Writing geom monareas with precision 6 decimals.
2026-06-03 13:53:26,310 - hydromt.model.components.geoms - geoms - INFO - delwaq.geoms: Writing geoms to /home/runner/work/hydromt_delwaq/hydromt_delwaq/docs/_examples/WQ_piave_monitoring/geoms/monpoints.geojson.
2026-06-03 13:53:26,310 - hydromt.model.components.geoms - geoms - DEBUG - Writing geom monpoints with precision 6 decimals.
2026-06-03 13:53:26,313 - hydromt.hydromt_delwaq.components.pointer - pointer - INFO - Writing pointer file in root/config
Writing dynamic data: 100%|██████████████████████| 9/9 [00:00<00:00, 578.82it/s]
2026-06-03 13:53:26,342 - hydromt.hydromt_delwaq.components.config - config - INFO - Writing model config to file.
The example above means the following: run hydromt with:
update delwaq: i.e. update a delwaq modelWQ_piave: original model folder-o ./WQ_piave_monitoring: output updated model folder-i delwaq_update_monitoring.yml: hydroMT configuration file containing the components and options to update-v: give some extra verbosity (2 * v) to display feedback on screen. Now debug messages are provided.
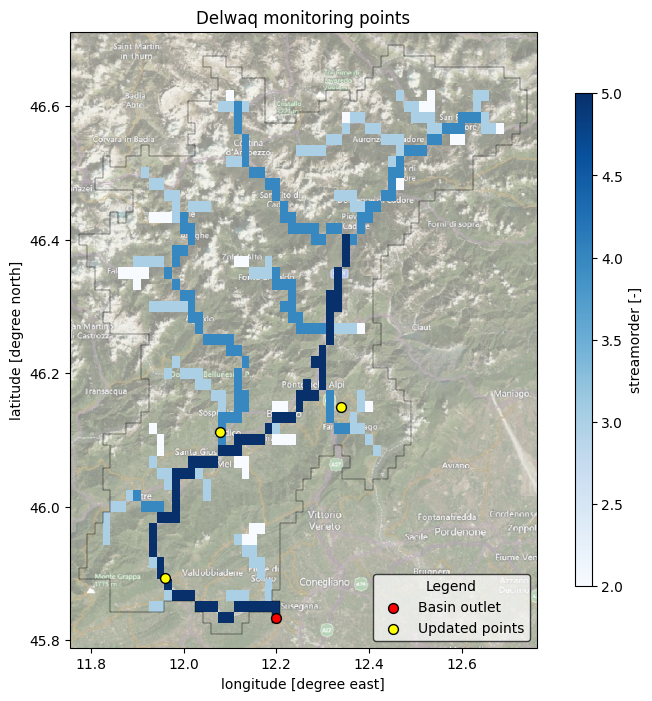
Visualization of the monitoring points#
We can now plot our newly created monitoring points.
[8]:
# Load the original and updated model with hydromt
mod0 = DelwaqModel(root='WQ_piave', mode='r')
mod1 = DelwaqModel(root='WQ_piave_monitoring', mode='r')
[9]:
# Plot
# we assume the model maps are in the geographic CRS EPSG:4326
proj = ccrs.PlateCarree()
# adjust zoomlevel and figure size to your basis size & aspect
zoom_level = 10
figsize=(10, 8)

# initialize image with geoaxes
fig = plt.figure(figsize=figsize)
ax = fig.add_subplot(projection=proj)
extent = np.array(mod0.staticdata.data.raster.box.buffer(0.02).total_bounds)[[0, 2, 1, 3]]
ax.set_extent(extent, crs=proj)

# add sat background image
ax.add_image(cimgt.QuadtreeTiles(), zoom_level, alpha=0.5)

# plot streamorder as background
da = mod0.staticdata.data['streamorder'].raster.mask_nodata()
da.attrs.update(long_name='streamorder', units='-')
## plot streamorder map
cmap = plt.cm.get_cmap('Blues')
kwargs = dict(cmap=cmap)
da.plot(transform=proj, ax=ax, zorder=1, cbar_kwargs=dict(aspect=30, shrink=.8), **kwargs)

# read/derive model basin boundary
gdf_bas = mod0.basins
# plot the basin boundary
gdf_bas.boundary.plot(ax=ax, color='k', linewidth=0.3)

if 'monpoints' in mod0.geoms.data:
    mod0.geoms.data['monpoints'].plot(ax=ax, marker='o', markersize=50, facecolor='red', edgecolor='k', zorder=5, label='Basin outlet')
if 'monpoints' in mod1.geoms.data:
    mod1.geoms.data['monpoints'].plot(ax=ax, marker='o', markersize=50, facecolor='yellow', edgecolor='k', zorder=5, label='Updated points')

ax.xaxis.set_visible(True)
ax.yaxis.set_visible(True)
ax.set_ylabel(f"latitude [degree north]")
ax.set_xlabel(f"longitude [degree east]")
_ = ax.set_title(f"Delwaq monitoring points")
legend = ax.legend(
    handles=[*ax.get_legend_handles_labels()[0]],
    title="Legend",
    loc='lower right',
    frameon=True,
    framealpha=0.7,
    edgecolor='k',
    facecolor='white'
)
/tmp/ipykernel_4184/2903712421.py:11: UserWarning: Geometry is in a geographic CRS. Results from 'buffer' are likely incorrect. Use 'GeoSeries.to_crs()' to re-project geometries to a projected CRS before this operation.

  extent = np.array(mod0.staticdata.data.raster.box.buffer(0.02).total_bounds)[[0, 2, 1, 3]]
/tmp/ipykernel_4184/2903712421.py:21: MatplotlibDeprecationWarning: The get_cmap function was deprecated in Matplotlib 3.7 and will be removed in 3.11. Use ``matplotlib.colormaps[name]`` or ``matplotlib.colormaps.get_cmap()`` or ``pyplot.get_cmap()`` instead.
  cmap = plt.cm.get_cmap('Blues')