Reservoirs
For modelling reservoirs, (natural) lakes or other water storage features that can be represented by the available functionality, a reservoir node is used that can be included as part of the river network.
General settings
By default the reservoirs are not included in the model. To include them put the following lines in the TOML file of the model:
[model]
reservoir__flag = true
Reservoir areas (coverage) and locations (outlet) are required and mapped between external and internal parameter names in the TOML file, with below an example:
[input]
reservoir_area__count = "wflow_reservoirareas"
reservoir_location__count = "wflow_reservoirlocs"
Reservoir modelling
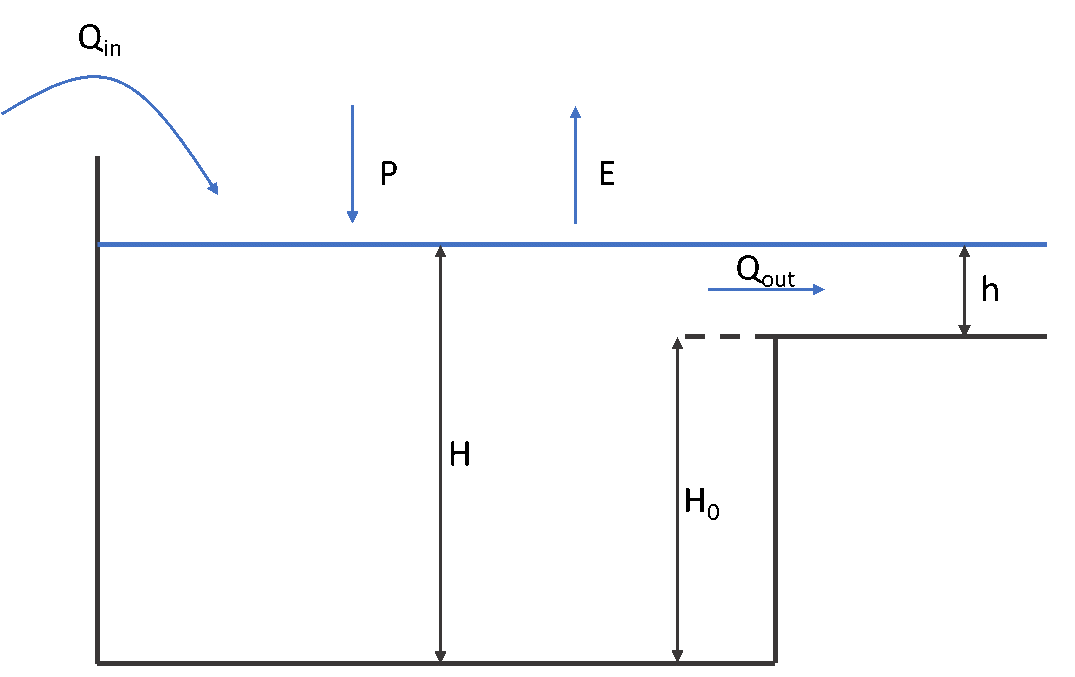
Reservoirs are modelled using a mass balance approach:
\[ \dfrac{S(t + \Delta t)}{\Delta t} = \dfrac{S(t)}{\Delta t} + \subtext{Q}{in} + \dfrac{(P-E) A}{\Delta t} - \subtext{Q}{out} \]
where \(\SIb{S}{m^3}\) is reservoir storage, \(\SIb{\Delta t}{s}\) is the model timestep, \(\SIb{\subtext{Q}{in}}{m^3\ s^{-1}}\) is the sum of inflows (river, overland and lateral subsurface flow), \(\SIb{\subtext{Q}{out}}{m^3\ s^{-1}}\) is the reservoir outflow at the outlet, \(\SIb{P}{m}\) is precipitation, \(\SIb{E}{m}\) is reservoir evaporation and \(\SIb{A}{m^2}\) is the reservoir surface area.
Most of the variables in this equation are known at the current or previous timestep, apart from \(S(t+ \Delta t)\) and \(\subtext{Q}{out}\) which can both be linked to the water level \(H\) in the reservoir using a storage curve \(S = f(H)\) and a rating curve \(Q = f(H)\). In wflow, several options are available to select storage and rating curves, and in most cases, the mass balance is then solved explicitly or by using the Modified Puls approach from Maniak (Burek et al., 2013). Storage curves in wflow can either:
- Come from the interpolation of field data linking volume and reservoir water level,
- Be computed from the simple relationship \(S = A H\).
Rating curves in wflow can either:
- Come from the interpolation of field data linking reservoir outflow and water level
- Be computed from a rating curve of the form \(\subtext{Q}{out} = \alpha (H-H_0)^\beta\), where \(H_{0}\) is the minimum water level under which the outflow is zero. Usual values for \(\beta\) are \(\frac{3}{2}\) for a rectangular weir or \(2\) for a parabolic weir (Bos, 1989).
- Be defined by simple reservoir operational parameters.
Modified Puls approach
The Modified Puls approach is solving the reservoir balance using an explicit relationship between storage and outflow. Storage is assumed to be equal to \(A H\) and the rating curve for a parabolic weir (\(\beta = 2\)) is used:
\[ S = A H = A (h + H_{0}) = A \sqrt{\frac{Q}{\alpha}} + A H_0 \]
Inserting this equation in the mass balance gives:
\[ \dfrac{A}{\Delta t} \sqrt{\frac{Q}{\alpha}} + Q = \dfrac{S(t)}{\Delta t} + \subtext{Q}{in} + A\dfrac{P-E}{\Delta t} - \dfrac{A H_0}{\Delta t} = \mathrm{SI} - \dfrac{A H_0}{\Delta t} \]
The solution for \(Q\) is then:
\[ Q = \begin{cases} \begin{align*} \frac{1}{4}\left(-\mathrm{LF} + \sqrt{\mathrm{LF}^{2} + 4 \left(\mathrm{SI} - \dfrac{A H_0}{\Delta t} \right)} \right)^2 &\text{ if }\quad \mathrm{SI} > \dfrac{A H_0}{\Delta t} \\ 0 &\text{ if }\quad \mathrm{SI} \leq \dfrac{A H_0}{\Delta t} \end{align*} \end{cases} \]
where
\[ \mathrm{LF} = \dfrac{A}{\Delta t \sqrt{\alpha}}. \]
Reservoir parameters
The following reservoir rating curve types reservoir_water__rating_curve_type_count are available:
- 1 for \(Q = f(H)\) from reservoir data and interpolation
- 2 for general \(Q = b(H - H_{0})^{e}\)
- 3 in the case of Modified Puls approach \(Q = b(H - H_{0})^{2}\)
- 4 simple reservoir operational parameters
And following reservoir storage curve types reservoir_water__storage_curve_type_count are available:
- 1 for \(S = AH\)
- 2 for \(S = f(H)\) from reservoir data and interpolation
Below an example of how the reservoir area, rating curve and storage curve types, required data for all reservoir types, are mapped between external and internal parameter names in the TOML file:
[input.static]
reservoir_surface__area = "reservoir_area"
reservoir_water__rating_curve_type_count = "outflowfunc"
reservoir_water__storage_curve_type_count = "storfunc"
Including reservoir rating and storage curves from data (rating curve type 1 and storage curve type 2) is described here.
For reservoir rating curve types 2 and 3 the following rating curve parameters need to be included in the TOML file, with below an example:
[input.static]
reservoir_water__rating_curve_coefficient = "reservoir_b"
reservoir_water__rating_curve_exponent = "reservoir_e"
reservoir_water_flow_threshold_level__elevation = "reservoir_threshold"
A reservoir with rating curve type 2 can be linked to a downstream reservoir and return flow can be allowed from the downstream to the upstream reservoir. The input parameter reservoir_lower_location__count (standard name) represents the downstream reservoir location ID of the upstream lake location.
For reservoir rating curve type 4, simple reservoir operational parameters need to included in the TOML file, with below an example:
[input.static]
reservoir_water_demand__required_downstream_volume_flow_rate = "ResDemand"
reservoir_water_release_below_spillway__max_volume_flow_rate = "ResMaxRelease"
reservoir_water__max_volume = "ResMaxVolume"
reservoir_water__target_full_volume_fraction = "ResTargetFullFrac"
reservoir_water__target_min_volume_fraction = "ResTargetMinFrac"
The complete list of reservoir input parameters that can be provided through the TOML file can be found here.
Please note that for reservoir input parameters (except reservoir_lower_location__count) missing values in the input data are not allowed, even if the parameter is not used by the reservoir type. For example, reservoir_water__rating_curve_exponent (for rating curve types 2 and 3) should also have a value (e.g. -1) for other input reservoir types.
Storage and rating curves from data
Storage and rating curves from field measurement can be supplied to wflow via CSV files supplied in the same folder of the TOML file. Naming of the files uses the ID of the reservoirs where data are available and is of the form reservoir_sh_1.csv and reservoir_hq_1.csv for respectively the storage and rating curves of reservoir with ID 1.
The storage curve is stored in a CSV file with reservoir level \(\SIb{}{m}\) in the first column H and corresponding reservoir storage \(\SIb{}{m^3}\) in the second column S:
H,  S
392.21, 0
393.21, 430202000
393.71, 649959000
394.21, 869719000
The rating curve uses level and discharge data depending on the Julian day of the year (JDOY). The first line contains H for the first column, and values ranging from 1 to 365 for the other columns, representing the Julian days of the year. The other lines contain the water level and the corresponding discharges for the different JDOY (1-365), see also the example below, that shows part of a CSV file (first 4 Julian days and Julian day 365). The volume above the maximum water level of the rating curve is assumed to flow instantaneously out of the reservoir (overflow).
H,      1,      2,      3,      4,      ..., 365
394,    43,     43,     43,     43,     ..., 43
394.01, 44.838, 44.838, 44.838, 44.838, ..., 44.838
394.02, 46.671, 46.671, 46.671, 46.671, ..., 46.671
394.03, 48.509, 48.509, 48.509, 48.509, ..., 48.509
394.04, 50.347, 50.347, 50.347, 50.347, ..., 50.347
394.05, 52.179, 52.179, 52.179, 52.179, ..., 52.179Please note that H in these two examples is defined as meters above sea level. When using option (1) for the storage curve, the level is defined as meters above reservoir bottom. Therefore, please be careful to ensure consistent units when using/combining storage and rating curves from data.
External inflows
External inflows \(\SIb{}{m^3\ s^{-1}}\) for example inflows that are not explicitly simulated by wflow or abstractions can be added to reservoirs, as a static or cyclic parameter or as part of forcing. For example, cyclic inflow can be provided in the TOML file as follows:
[input.cyclic]
reservoir_water__external_inflow_volume_flow_rate = "reservoir_inflow"
These inflows are added or subtracted from the reservoir inflow. In case of an abstraction (negative inflow), the abstraction is limited by a fixed scaling factor of \(0.98\) applied to reservoir storage. Negative external inflows are satisfied first, and the remaining reservoir storage is available for internal abstractions as part of water demand and allocation computations.
Using observed outflow
When reservoir observed outflow data is available, it is possible to use this data directly for computing the reservoir water balance rather than using a rating curve. This data can be provided as a static or cyclic parameter or as part of forcing. For example, cyclic observed outflow can be provided in the TOML file as follows:
[input.cyclic]
reservoir_water__outgoing_observed_volume_flow_rate = "reservoir_outflow"
The reservoir outflow is not equal to the user-defined observed reservoir outflow in case not enough reservoir water storage is available. For reservoirs with a maximum storage, spillage is allowed when storage is exceeding the maximum storage with the user-defined observed reservoir outflow. Overflow because of spilling is added to the observed reservoir outflow. When missing data in the input netCDF file for observed reservoir outflow at a reservoir location is provided the rating curve of that reservoir location is used.
References
- Bos M.G., 1989. Discharge measurement structures. Third revised edition, International Institute for Land Reclamation and Improvement ILRI, Wageningen, The Netherlands.
- Burek P., Van der Knijf J.M., Ad de Roo, 2013. LISFLOOD – Distributed Water Balance and flood Simulation Model – Revised User Manual. DOI: http://dx.doi.org/10.2788/24719.