Mesh2d refinement based on Gebco gridded samples with variable depth precision
This is a brief introduction to the process of mesh refinement using gridded samples from Gebco global dataset.
It is also an example of
Generating a mesh of defined extension
Saving the generated mesh to UGrid file
Reading bathymetric data form a large NetDFC file
Performing mesh refinement based on uniformly spaced gridded bathymetric data (fast), non-uniformly spaced bathymetric data (slow).
Import necessary libraries, close all figures
import meshkernel
import numpy as np
import matplotlib.pyplot as plt

plt.close("all")
1. Generating a mesh of defined extension
# general settings
lon_min, lon_max = -1, -0.2
lat_min, lat_max = 49.1, 49.6
lon_res, lat_res = 0.1, 0.1
figsize = (10, 4)
crs = "EPSG:4326"

"""
Make a regular (potentially rotated) rectilinear grid. First generate a curvilinear grid than convert the curvilinear grid into unstructured grid. The steps are the following:
- curvilinear_compute_uniform_on_extension, see the following notebook: https://github.com/Deltares/MeshKernelPy/blob/AddCurvilinearGridSupport/docs/examples/04_curvilineargrid_basics.ipynb
- curvilinear_convert_to_mesh2d: https://github.com/Deltares/MeshKernelPy/blob/118cb4953c4e95d5b18ed283bb37f391134b2bb2/meshkernel/meshkernel.py#L1399
"""

# Create an instance of MakeGridParameters and set the values
make_grid_parameters = meshkernel.MakeGridParameters()
make_grid_parameters.origin_x = lon_min
make_grid_parameters.origin_y = lat_min
make_grid_parameters.upper_right_x = lon_max
make_grid_parameters.upper_right_y = lat_max
make_grid_parameters.block_size_x = lon_res
make_grid_parameters.block_size_y = lat_res


mk2 = meshkernel.MeshKernel(projection=meshkernel.ProjectionType.SPHERICAL)
mk2.curvilinear_compute_rectangular_grid_on_extension(make_grid_parameters)
mk2.curvilinear_convert_to_mesh2d()  # convert to ugrid/mesh2d

mesh2d = mk2.mesh2d_get()
fig, ax = plt.subplots()
mesh2d.plot_edges(ax)
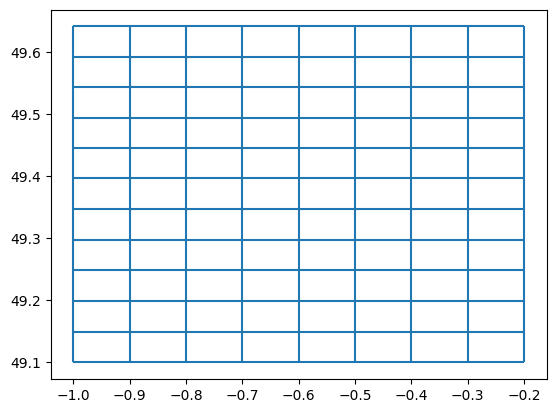
2. Saving the generated mesh to UGrid file
To save the generated mesh to a UGrid file, you can use the following code snippet. Please note that in order to execute the code below, the UGrid Python package needs to be installed.
ugrid_installed = False
if ugrid_installed:
    from ugrid import UGrid, UGridMesh2D

    mesh2d_ugrid = UGrid.from_meshkernel_mesh2d_to_ugrid_mesh2d(
        mesh2d=mesh2d, name="mesh2d", is_spherical=True
    )

    attribute_dict = {
        "name": "Unknown projected",
        "epsg": np.array([4326], dtype=int),
        "grid_mapping_name": "Unknown projected",
        "longitude_of_prime_meridian": np.array([0.0], dtype=float),
        "semi_major_axis": np.array([6378137.0], dtype=float),
        "semi_minor_axis": np.array([6356752.314245], dtype=float),
        "inverse_flattening": np.array([6356752.314245], dtype=float),
        "EPSG_code": "EPSG:4326",
        "value": "value is equal to EPSG code",
    }

    with UGrid("./gebco_mesh2d_net.nc", "w+") as ug:
        # 1. Define a new mesh2d
        topology_id = ug.mesh2d_define(mesh2d_ugrid)
        # 3. Put a new mesh2d
        ug.mesh2d_put(topology_id, mesh2d_ugrid)
        # 3. Add crs to file
        ug.variable_int_with_attributes_define("wgs84", attribute_dict)
        # 4. Add conventions (global attributes)
        conventions = {
            "institution": "Deltares",
            "references": "Unknown",
            "source": "Unknown Unknown. Model: Unknown",
            "history": "Created on 2017-11-27T18:05:09+0100, Unknown",
            "Conventions": "CF-1.6 UGRID-1.0/Deltares-0.8",
        }
        ug.attribute_global_define(conventions)
3. Reading bathymetric data form a large NetDFC file
Bathymetric data can be read from a large dataset using the xarray package, which allows you to load only a selected portion of the data. When the longitude and latitude arrays are assumed not uniformly spaced, bilinear interpolation is slower
# select and plot bathy
uniform_grid_spacing = False
if not uniform_grid_spacing:
    import xarray as xr

    file_nc_bathy = r"p:\metocean-data\open\GEBCO\2021\GEBCO_2021.nc"
    data_bathy = xr.open_dataset(file_nc_bathy)
    data_bathy_sel = data_bathy.sel(
        lon=slice(lon_min - 1 / 4, lon_max + 1 / 4),
        lat=slice(lat_min - 1 / 4, lat_max + 1 / 4),
    )

    lon_np = data_bathy_sel.lon.to_numpy().flatten().astype("float")
    lat_np = data_bathy_sel.lat.to_numpy().flatten().astype("float")
    values_np = data_bathy_sel.elevation.to_numpy().flatten().astype("float32")
Otherwise, read from ascii, assuming uniform spacing
def read_asc_file(file_path, dtype=np.float32):
    """Reads asc file and returns headers and data as numpy array
    Args:
            file_path (str): The file path
    Returns:
            header: The ascii header
            data: The ascii data as a numpy array of doubles
    """

    header = {}
    data = []

    with open(file_path, "r") as file:
        # Read header information
        for _ in range(6):
            line = file.readline().strip().split()
            header[line[0]] = float(line[1])

        # Read data values
        for line in file:
            data_row = [float(value) for value in line.strip().split()]
            data.insert(0, data_row)  # Insert row at the beginning

        # Flatten the data
        data = np.array(data).flatten().astype(dtype)

    return header, data
4. Performing mesh refinement based on gridded data, depths as np.float32 or np.int16
Read the depths in file as np.float32
header, values_np = read_asc_file("./data_examples/gebco.asc", dtype=np.float32)
Read the depths in file as np.int16
header, values_np = read_asc_file("./data_examples/gebco.asc", dtype=np.int16)
Grid properties
num_x = int(header["ncols"])
num_y = int(header["nrows"])
x_origin = header["xllcenter"]
y_origin = header["yllcenter"]
Gridded samples
gridded_samples = meshkernel.GriddedSamples(
    num_x=num_x,
    num_y=num_y,
    x_origin=x_origin,
    y_origin=y_origin,
    cell_size=0.0041666666666,
    values=values_np,
)
Another option is to generate gridded samples from an array of x and y coordinates, not uniformly spaced
if not uniform_grid_spacing:
    gridded_samples = meshkernel.GriddedSamples(
        x_coordinates=lon_np,
        y_coordinates=lat_np,
        num_x=len(lon_np),
        num_y=len(lat_np),
        values=values_np,
    )
Define the mesh refinement parameters
mesh_refinement_parameters = meshkernel.MeshRefinementParameters(
    refine_intersected=False,
    use_mass_center_when_refining=False,
    min_edge_size=500,
    refinement_type=meshkernel.RefinementType.WAVE_COURANT,
    connect_hanging_nodes=True,
    account_for_samples_outside_face=False,
    max_refinement_iterations=3,
    smoothing_iterations=5,
    max_courant_time=120.0,
    directional_refinement=0,
)
Perform the refinement (Bilinear interpolation will be used)
mk2.mesh2d_refine_based_on_gridded_samples(
    gridded_samples=gridded_samples,
    mesh_refinement_params=mesh_refinement_parameters,
    use_nodal_refinement=True,
)
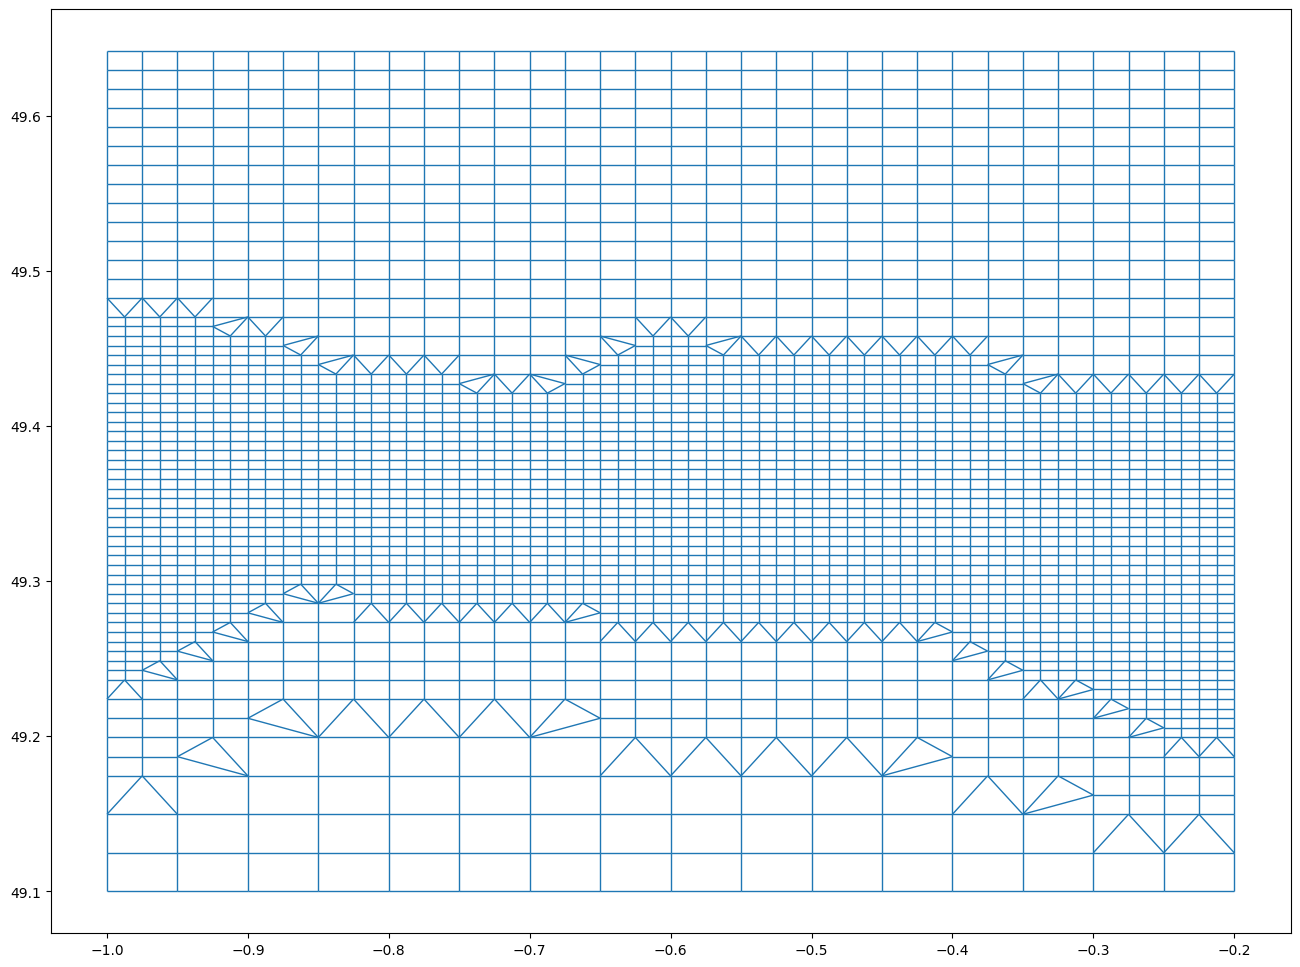
Plot the refined mesh
# zoomed in plot to focus on patchy coastlines
fig1 = plt.figure(figsize=(16, 12))
ax1 = fig1.add_subplot(111)

mesh2d_grid2 = mk2.mesh2d_get()
mesh2d_grid2.plot_edges(ax1, linewidth=1)