Post-processing example#
If you prefer to interact with a Python script instead, you can convert this notebook to *.py with jupyter nbconvert --to script postprocessing_example.ipynb.
For more advanced mapfile operations: Deltares/dfm_tools
[1]:
# imports
import xarray as xr
import matplotlib.pyplot as plt
import contextily as ctx
import numpy as np
import dfm_tools as dfmt
[2]:
# set paths and parameters per model
# the necessary data is automatically downloaded from opendap if needed
model = 'grevelingen' # 'curvedbend' 'grevelingen' 'westernscheldt'

if model=='curvedbend': # sigma layers
    file_nc_his = dfmt.data.fm_curvedbend_his(return_filepath=True)
    file_nc_map = dfmt.data.fm_curvedbend_map(return_filepath=True)
    varn_his = 'salinity'
    sel_slice_x, sel_slice_y = slice(1500,3500), slice(1000,3500)
    layer = 5
    crs = None
    raster_res = 100
    scale = 1.5
    line_array = np.array([[ 104.15421399, 2042.7077107 ],
                           [2913.47878063, 2102.48057382]])
    remove_edges = False
elif model=='grevelingen': # z-layers
    file_nc_his = dfmt.data.fm_grevelingen_his(return_filepath=True)
    file_nc_map = dfmt.data.fm_grevelingen_map(return_filepath=True)
    varn_his = 'salinity'
    sel_slice_x, sel_slice_y = slice(50000,55000), slice(None,424000)
    layer = 34
    crs = 'EPSG:28992'
    raster_res = 500
    scale = 1.5
    line_array = np.array([[ 53181.96942503, 424270.83361629],
                           [ 55160.15232593, 416913.77136685]])
    remove_edges = False
elif model=='westernscheldt': # zsigma with ocean_sigma_z_coordinate (no fullgrid)
    file_nc_his = dfmt.data.fm_westernscheldt_his(return_filepath=True)
    file_nc_map = dfmt.data.fm_westernscheldt_map(return_filepath=True)
    varn_his = 'velocity_magnitude'
    sel_slice_x, sel_slice_y = slice(None,45000), slice(375000,None)
    layer = -1
    crs = 'EPSG:28992'
    raster_res = 1000
    scale = 50
    line_array = np.array([[ 38009.13018277, 379668.57110041],
                           [ 49669.4304515 , 376094.81094157]])
    remove_edges = True
else:
    raise Exception(f'undefined model: {model}')
[3]:
# open hisfile with xarray and print netcdf structure
ds_his = xr.open_mfdataset(file_nc_his, preprocess=dfmt.preprocess_hisnc)
ds_his
Your model was run with a D-FlowFM version from before 28-10-2020 (D-Flow FM Version 1.2.41.63609 from Apr 08 2019), the layers in the hisfile are incorrect. Check UNST-2920 and UNST-3024 for more information, it was fixed from OSS 67858.
dropping 45 duplicate "source_sink_name" labels to avoid InvalidIndexError
[3]:
<xarray.Dataset> Size: 12MB
Dimensions:                                       (stations: 24, time: 145,
                                                   laydim: 36, laydimw: 37,
                                                   source_sink_pts: 2,
                                                   source_sink: 1)
Coordinates:
    station_x_coordinate                          (stations) float64 192B 4.7...
    station_y_coordinate                          (stations) float64 192B 4.1...
    zcoordinate_c                                 (time, stations, laydim) float64 1MB dask.array<chunksize=(145, 24, 36), meta=np.ndarray>
    zcoordinate_w                                 (time, stations, laydimw) float64 1MB dask.array<chunksize=(145, 24, 37), meta=np.ndarray>
  * time                                          (time) datetime64[ns] 1kB 2...
  * stations                                      (stations) <U25 2kB 'GTSO-0...
  * source_sink                                   (source_sink) <U2 8B ''
Dimensions without coordinates: laydim, laydimw, source_sink_pts
Data variables: (12/42)
    station_id                                    (stations) |S64 2kB dask.array<chunksize=(24,), meta=np.ndarray>
    waterlevel                                    (time, stations) float64 28kB dask.array<chunksize=(145, 24), meta=np.ndarray>
    bedlevel                                      (stations) float64 192B dask.array<chunksize=(24,), meta=np.ndarray>
    waterdepth                                    (time, stations) float64 28kB dask.array<chunksize=(145, 24), meta=np.ndarray>
    x_velocity                                    (time, stations, laydim) float64 1MB dask.array<chunksize=(145, 24, 36), meta=np.ndarray>
    y_velocity                                    (time, stations, laydim) float64 1MB dask.array<chunksize=(145, 24, 36), meta=np.ndarray>
    ...                                            ...
    water_balance_groundwater_out                 (time) float64 1kB dask.array<chunksize=(145,), meta=np.ndarray>
    water_balance_groundwater_total               (time) float64 1kB dask.array<chunksize=(145,), meta=np.ndarray>
    water_balance_laterals_in                     (time) float64 1kB dask.array<chunksize=(145,), meta=np.ndarray>
    water_balance_laterals_out                    (time) float64 1kB dask.array<chunksize=(145,), meta=np.ndarray>
    water_balance_laterals_total                  (time) float64 1kB dask.array<chunksize=(145,), meta=np.ndarray>
    timestep                                      (time) float64 1kB dask.array<chunksize=(145,), meta=np.ndarray>
Attributes:
    institution:    Deltares
    references:     http://www.deltares.nl
    source:         Deltares, D-Flow FM Version 1.2.41.63609, Apr 08 2019, 22...
    history:        Created on 2019-08-14T15:51:59+0200, D-Flow FM
    date_created:   2019-08-14T15:51:59+0200
    date_modified:  2019-08-14T15:51:59+0200
Conventions: CF-1.5 Deltares-0.1[4]:
# get and print variable properties
vars_pd = dfmt.get_ncvarproperties(ds_his)
vars_pd
[4]:
| units | standard_name | long_name | shape | dimensions | dtype | grid_mapping | positive | |
|---|---|---|---|---|---|---|---|---|
| station_x_coordinate | m | projection_x_coordinate | original x-coordinate of station (non-snapped) | (24,) | (stations,) | float64 | ||
| station_y_coordinate | m | projection_y_coordinate | original y-coordinate of station (non-snapped) | (24,) | (stations,) | float64 | ||
| station_id | observation station identifier | (24,) | (stations,) | |S64 | ||||
| waterlevel | m | sea_surface_height | water level | (145, 24) | (time, stations) | float64 | ||
| bedlevel | m | bottom level | (24,) | (stations,) | float64 | |||
| waterdepth | m | water depth | (145, 24) | (time, stations) | float64 | projected_coordinate_system | ||
| x_velocity | m s-1 | sea_water_x_velocity | flow element center velocity vector, x-component | (145, 24, 36) | (time, stations, laydim) | float64 | ||
| y_velocity | m s-1 | sea_water_y_velocity | flow element center velocity vector, y-component | (145, 24, 36) | (time, stations, laydim) | float64 | ||
| z_velocity | m s-1 | upward_sea_water_velocity | vertical/upward component of flow element cent... | (145, 24, 36) | (time, stations, laydim) | float64 | ||
| tke | m2 s-2 | specific_turbulent_kinetic_energy_of_sea_water | turbulent kinetic energy | (145, 24, 37) | (time, stations, laydimw) | float64 | projected_coordinate_system | |
| vicww | m2 s-1 | turbulent vertical eddy viscosity | (145, 24, 37) | (time, stations, laydimw) | float64 | projected_coordinate_system | ||
| eps | m2 s-3 | specific_turbulent_kinetic_energy_dissipation_... | turbulent energy dissipation | (145, 24, 37) | (time, stations, laydimw) | float64 | projected_coordinate_system | |
| rich | Richardson Nr | (145, 24, 37) | (time, stations, laydimw) | float64 | projected_coordinate_system | |||
| salinity | 1e-3 | salinity | (145, 24, 36) | (time, stations, laydim) | float64 | |||
| temperature | degC | sea_water_temperature | (145, 24, 36) | (time, stations, laydim) | float64 | |||
| density | kg m-3 | density | (145, 24, 36) | (time, stations, laydim) | float64 | |||
| windx | m s-1 | x_wind | velocity of air on flow element center, x-comp... | (145, 24) | (time, stations) | float64 | ||
| windy | m s-1 | y_wind | velocity of air on flow element center, y-comp... | (145, 24) | (time, stations) | float64 | ||
| zcoordinate_c | m | vertical coordinate at center of flow element ... | (145, 24, 36) | (time, stations, laydim) | float64 | projected_coordinate_system | up | |
| zcoordinate_w | m | vertical coordinate at center of flow element ... | (145, 24, 37) | (time, stations, laydimw) | float64 | projected_coordinate_system | up | |
| source_sink_x_coordinate | m | projection_x_coordinate | x-coordinate | (2, 1) | (source_sink_pts, source_sink) | float64 | ||
| source_sink_y_coordinate | m | projection_y_coordinate | y-coordinate | (2, 1) | (source_sink_pts, source_sink) | float64 | ||
| source_sink_prescribed_discharge | m3 s-1 | (145, 1) | (time, source_sink) | float64 | ||||
| source_sink_prescribed_salinity_increment | 1e-3 | (145, 1) | (time, source_sink) | float64 | ||||
| source_sink_prescribed_temperature_increment | degC | (145, 1) | (time, source_sink) | float64 | ||||
| source_sink_current_discharge | m3 s-1 | (145, 1) | (time, source_sink) | float64 | ||||
| source_sink_cumulative_volume | m3 | Cumulative volume from the start time until cu... | (145, 1) | (time, source_sink) | float64 | |||
| source_sink_discharge_average | m3 s-1 | Average discharge in the past his-file output-... | (145, 1) | (time, source_sink) | float64 | |||
| water_balance_total_volume | m3 | (145,) | (time,) | float64 | ||||
| water_balance_storage | m3 | (145,) | (time,) | float64 | ||||
| water_balance_volume_error | m3 | (145,) | (time,) | float64 | ||||
| water_balance_boundaries_in | m3 | (145,) | (time,) | float64 | ||||
| water_balance_boundaries_out | m3 | (145,) | (time,) | float64 | ||||
| water_balance_boundaries_total | m3 | (145,) | (time,) | float64 | ||||
| water_balance_exchange_with_1D_in | m3 | (145,) | (time,) | float64 | ||||
| water_balance_exchange_with_1D_out | m3 | (145,) | (time,) | float64 | ||||
| water_balance_exchange_with_1D_total | m3 | (145,) | (time,) | float64 | ||||
| water_balance_precipitation | m3 | (145,) | (time,) | float64 | ||||
| water_balance_source_sink | m3 | (145,) | (time,) | float64 | ||||
| water_balance_groundwater_in | m3 | (145,) | (time,) | float64 | ||||
| water_balance_groundwater_out | m3 | (145,) | (time,) | float64 | ||||
| water_balance_groundwater_total | m3 | (145,) | (time,) | float64 | ||||
| water_balance_laterals_in | m3 | (145,) | (time,) | float64 | ||||
| water_balance_laterals_out | m3 | (145,) | (time,) | float64 | ||||
| water_balance_laterals_total | m3 | (145,) | (time,) | float64 | ||||
| time | time | (145,) | (time,) | datetime64[ns] | ||||
| timestep | s | latest computational timestep size in each out... | (145,) | (time,) | float64 | |||
| stations | (24,) | (stations,) | <U25 | |||||
| source_sink | (1,) | (source_sink,) | <U2 |
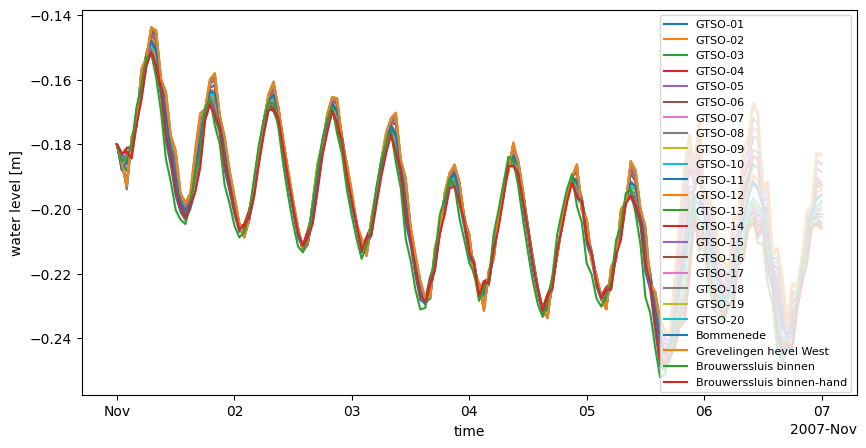
[5]:
# plot his data: waterlevel at stations
fig, ax = plt.subplots(1,1,figsize=(10,5))
ds_his.waterlevel.plot.line(ax=ax, x='time')
ax.legend(ds_his.stations.to_series(), loc=1, fontsize=8) # optionally change legend location and fontsize
[5]:
<matplotlib.legend.Legend at 0x188ea272e70>
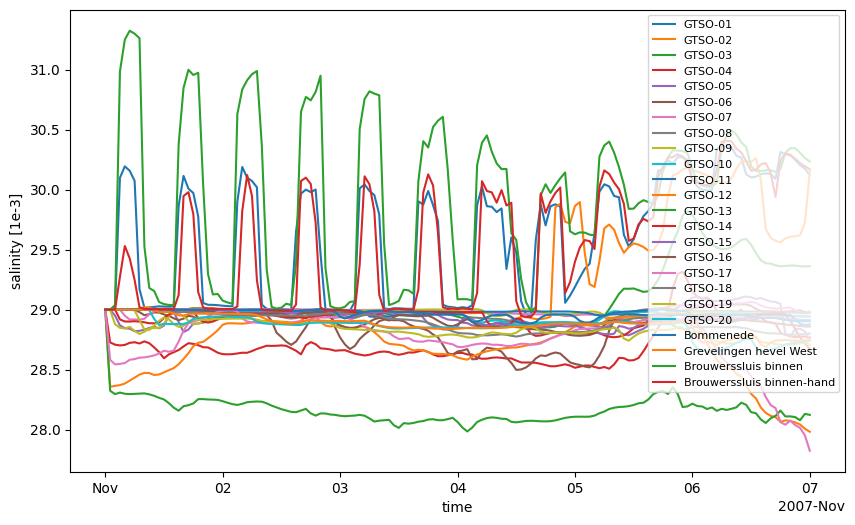
[6]:
# plot his data: salinity at stations
data_fromhis_xr = ds_his[varn_his].isel(laydim=-1)
fig, ax = plt.subplots(figsize=(10,6))
data_fromhis_xr.plot.line('-',ax=ax,x='time')
ax.legend(ds_his.stations.to_series(), loc=1, fontsize=8) # optionally change legend location and fontsize
[6]:
<matplotlib.legend.Legend at 0x188ec541e20>
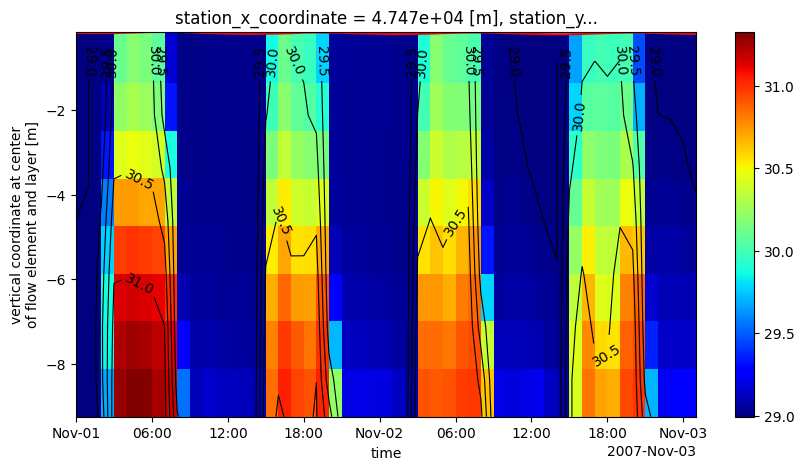
[7]:
# plot his data: temperature zt at one station
ds_his_sel = ds_his.isel(stations=0).isel(time=slice(0,50))
fig, ax = plt.subplots(1,1,figsize=(10,5))
ds_his_sel.waterlevel.plot.line(ax=ax,color='r') # waterlevel line
pc = dfmt.plot_ztdata(ds_his_sel, varname=varn_his, ax=ax, cmap='jet') # salinity pcolormesh
fig.colorbar(pc,ax=ax)
CS = dfmt.plot_ztdata(ds_his_sel, varname=varn_his, ax=ax, only_contour=True, levels=6, colors='k', linewidths=0.8) # salinity contour
ax.clabel(CS, fontsize=10)
[7]:
<a list of 24 text.Text objects>
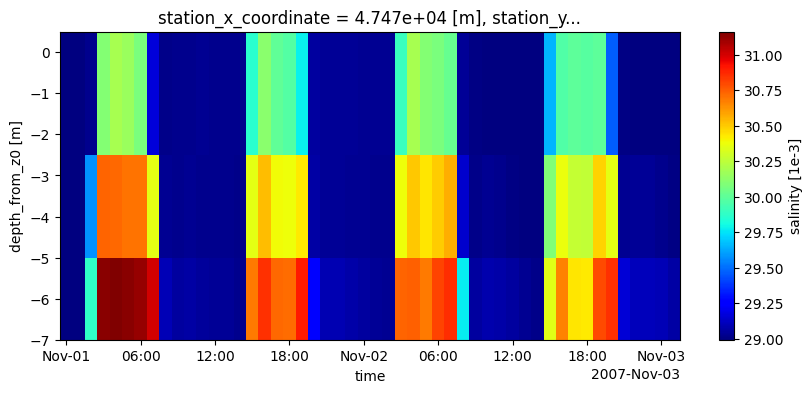
[8]:
# plot his data: zt salinity plot sliced at depth(s)
depths = [-1,-4,0,-6]
# slice at depth w.r.t. z0/waterlevel/bedlevel
data_fromhis_atdepths = dfmt.get_Dataset_atdepths(data_xr=ds_his, depths=depths, reference='z0')
data_xr_selzt = data_fromhis_atdepths.isel(stations=0).isel(time=slice(0,50))
fig, ax = plt.subplots(1,1,figsize=(10,4))
data_xr_selzt[varn_his].plot(ax=ax, cmap='jet', x='time')
>> subsetting data on fixed depth in fullgrid z-data: 0.05 sec
[8]:
<matplotlib.collections.QuadMesh at 0x188ea3f66c0>
[9]:
# open+merge mapfile with xugrid(xarray) and print netcdf structure
uds_map = dfmt.open_partitioned_dataset(file_nc_map, remove_edges=remove_edges)
uds_map
>> xu.open_dataset() with 8 partition(s): 1 2 3 4 5 6 7 8 : 1.86 sec
0.52 secrge_partitions() with 8 partition(s):
>> some variables dropped with merging of partitions: ['mesh2d_face_x_bnd', 'mesh2d_face_y_bnd']
>> dfmt.open_partitioned_dataset() total: 2.38 sec
[9]:
<xarray.Dataset> Size: 1GB
Dimensions:                      (time: 4, nmesh2d_interface: 37,
                                  nmesh2d_layer: 36, nmesh2d_node: 23108,
                                  nmesh2d_face: 44796, nmesh2d_edge: 67906,
                                  Two: 2)
Coordinates:
  * time                         (time) datetime64[ns] 32B 2007-11-01 ... 200...
    mesh2d_node_x                (nmesh2d_node) float64 185kB dask.array<chunksize=(23108,), meta=np.ndarray>
    mesh2d_node_y                (nmesh2d_node) float64 185kB dask.array<chunksize=(23108,), meta=np.ndarray>
    mesh2d_face_y                (nmesh2d_face) float64 358kB dask.array<chunksize=(44796,), meta=np.ndarray>
    mesh2d_face_x                (nmesh2d_face) float64 358kB dask.array<chunksize=(44796,), meta=np.ndarray>
    mesh2d_edge_y                (nmesh2d_edge) float64 543kB dask.array<chunksize=(67906,), meta=np.ndarray>
    mesh2d_edge_x                (nmesh2d_edge) float64 543kB dask.array<chunksize=(67906,), meta=np.ndarray>
  * nmesh2d_face                 (nmesh2d_face) int64 358kB 0 1 ... 44794 44795
  * nmesh2d_node                 (nmesh2d_node) int64 185kB 0 1 ... 23106 23107
  * nmesh2d_edge                 (nmesh2d_edge) int64 543kB 0 1 ... 67904 67905
Dimensions without coordinates: nmesh2d_interface, nmesh2d_layer, Two
Data variables: (12/42)
    timestep                     (time) float64 32B dask.array<chunksize=(1,), meta=np.ndarray>
    mesh2d_interface_z           (nmesh2d_interface) float64 296B dask.array<chunksize=(37,), meta=np.ndarray>
    projected_coordinate_system  int32 4B ...
    mesh2d_layer_z               (nmesh2d_layer) float64 288B dask.array<chunksize=(36,), meta=np.ndarray>
    mesh2d_node_z                (nmesh2d_node) float64 185kB dask.array<chunksize=(23108,), meta=np.ndarray>
    mesh2d_ucmaga                (time, nmesh2d_face) float64 1MB dask.array<chunksize=(1, 44796), meta=np.ndarray>
    ...                           ...
    mesh2d_u1                    (time, nmesh2d_edge, nmesh2d_layer) float64 78MB dask.array<chunksize=(1, 67906, 36), meta=np.ndarray>
    mesh2d_q1                    (time, nmesh2d_edge, nmesh2d_layer) float64 78MB dask.array<chunksize=(1, 67906, 36), meta=np.ndarray>
    mesh2d_tureps1               (time, nmesh2d_edge, nmesh2d_interface) float64 80MB dask.array<chunksize=(1, 67906, 37), meta=np.ndarray>
    mesh2d_diu                   (time, nmesh2d_edge, nmesh2d_layer) float64 78MB dask.array<chunksize=(1, 67906, 36), meta=np.ndarray>
    mesh2d_cfcl                  (time, nmesh2d_edge) float64 2MB dask.array<chunksize=(1, 67906), meta=np.ndarray>
mesh2d_viu (time, nmesh2d_edge, nmesh2d_layer) float64 78MB dask.array<chunksize=(1, 67906, 36), meta=np.ndarray>[10]:
# get and print variable properties
vars_pd = dfmt.get_ncvarproperties(uds_map)
vars_pd.head(10)
[10]:
| long_name | units | shape | dimensions | dtype | standard_name | unit | name | epsg | grid_mapping_name | ... | mesh | location | grid_mapping | cell_methods | cell_measures | bounds | flag_values | flag_meanings | comment | non_si_units | |
|---|---|---|---|---|---|---|---|---|---|---|---|---|---|---|---|---|---|---|---|---|---|
| timestep | Latest computational timestep size in each out... | s | (4,) | (time,) | float64 | ... | |||||||||||||||
| mesh2d_interface_z | Vertical coordinate of layer interfaces | (37,) | (nmesh2d_interface,) | float64 | altitude | m | ... | ||||||||||||||
| projected_coordinate_system | () | () | int32 | Amersfoort / RD New | 28992 | Unknown projected | ... | ||||||||||||||
| mesh2d_layer_z | Vertical coordinate of layer centres | (36,) | (nmesh2d_layer,) | float64 | altitude | m | ... | ||||||||||||||
| time | (4,) | (time,) | datetime64[ns] | time | ... | ||||||||||||||||
| mesh2d_node_z | z-coordinate of mesh nodes | m | (23108,) | (nmesh2d_node,) | float64 | altitude | ... | mesh2d | node | projected_coordinate_system | |||||||||||
| mesh2d_node_x | x-coordinate of mesh nodes | m | (23108,) | (nmesh2d_node,) | float64 | projection_x_coordinate | ... | mesh2d | node | ||||||||||||
| mesh2d_node_y | y-coordinate of mesh nodes | m | (23108,) | (nmesh2d_node,) | float64 | projection_y_coordinate | ... | mesh2d | node | ||||||||||||
| mesh2d_ucmaga | Flow element center depth-averaged velocity ma... | m s-1 | (4, 44796) | (time, nmesh2d_face) | float64 | sea_water_speed | ... | mesh2d | face | projected_coordinate_system | nmesh2d_face: mean | area: mesh2d_flowelem_ba | |||||||||
| mesh2d_tem1 | Temperature in flow element | degC | (4, 44796, 36) | (time, nmesh2d_face, nmesh2d_layer) | float64 | sea_water_temperature | ... | mesh2d | face | projected_coordinate_system | nmesh2d_face: mean |
10 rows × 29 columns
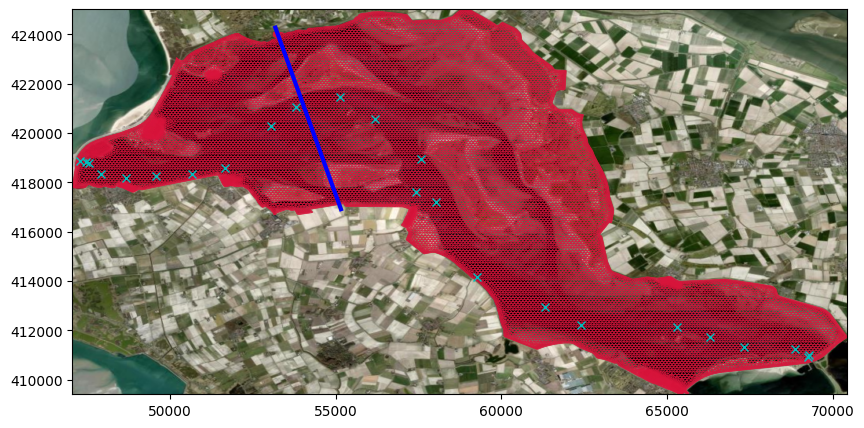
[11]:
# plot net/grid. use random variable and plot line to get grid
fig, ax = plt.subplots(figsize=(10,5))
pc = uds_map.grid.plot(edgecolor='crimson', linewidth=0.5)
if crs is None:
    ax.set_aspect('equal')
else:
    ctx.add_basemap(ax=ax, source=ctx.providers.Esri.WorldImagery, crs=crs, attribution=False)
if line_array is not None:
    ax.plot(line_array[:,0],line_array[:,1],'b',linewidth=3)

# add stations locations
if file_nc_his is not None:
    ax.plot(ds_his['station_x_coordinate'], ds_his['station_y_coordinate'], 'xc')
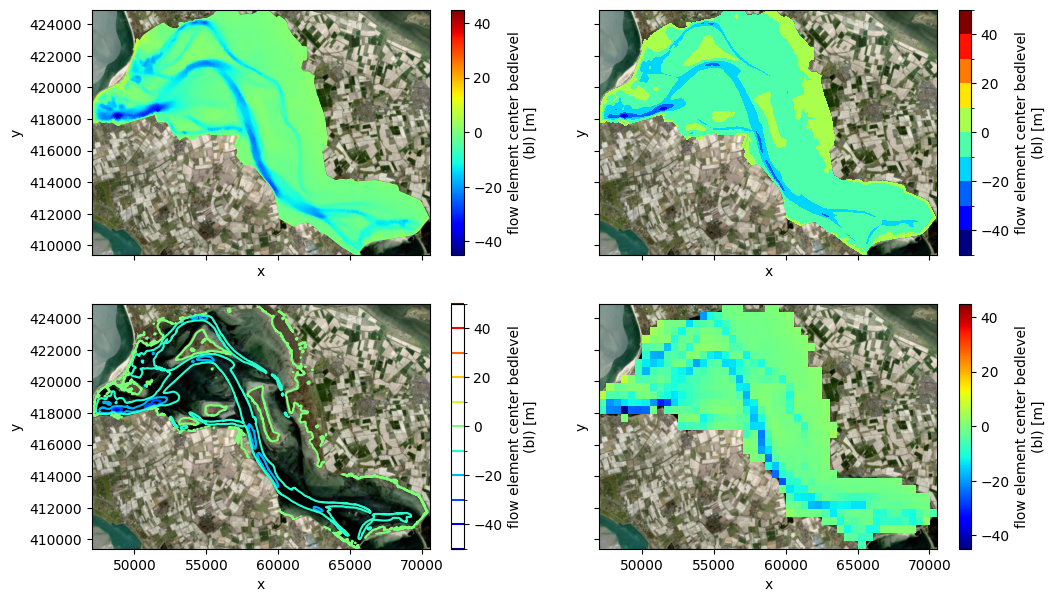
[12]:
# plot bedlevel on map, including contour/contourf/rasterized
fig, ((ax1,ax2),(ax3,ax4)) = plt.subplots(2,2,figsize=(12,7),sharex=True,sharey=True)
pc = uds_map['mesh2d_flowelem_bl'].ugrid.plot(ax=ax1, cmap='jet')
pc = uds_map['mesh2d_flowelem_bl'].ugrid.plot.contourf(ax=ax2, levels=11, cmap='jet')
pc = uds_map['mesh2d_flowelem_bl'].ugrid.plot.contour(ax=ax3, levels=11, cmap='jet', add_colorbar=True)
bl_raster = dfmt.rasterize_ugrid(uds_map[['mesh2d_flowelem_bl']],resolution=raster_res) #rasterize ugrid
pc = bl_raster['mesh2d_flowelem_bl'].plot(ax=ax4, cmap='jet') #plot with non-ugrid method
for ax in (ax1,ax2,ax3,ax4):
    if crs is None:
        ax.set_aspect('equal')
    else:
        ctx.add_basemap(ax=ax, source=ctx.providers.Esri.WorldImagery, crs=crs, attribution=False)
>> rasterizing ugrid Dataset with 1 face variables to shape=(31,47): 0.34 sec
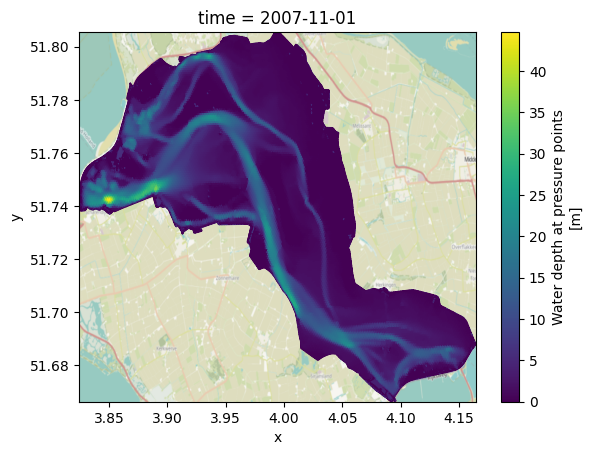
[13]:
# convert coordinates
if crs == 'EPSG:28992':
    to_crs = 'EPSG:4326'
elif crs == 'EPSG:4326':
    to_crs = 'EPSG:28992'
if crs is not None:
    if model=='westernscheldt':
        uds_map.ugrid.set_crs(crs, allow_override=True) # westernscheldt file has incorrect crs information
    uds_map_conv = uds_map.ugrid.to_crs(to_crs)
    fig, ax = plt.subplots()
    uds_map_conv["mesh2d_waterdepth"].isel(time=0).ugrid.plot(ax=ax)
    ctx.add_basemap(ax=ax, source=None, crs=to_crs, attribution=False)
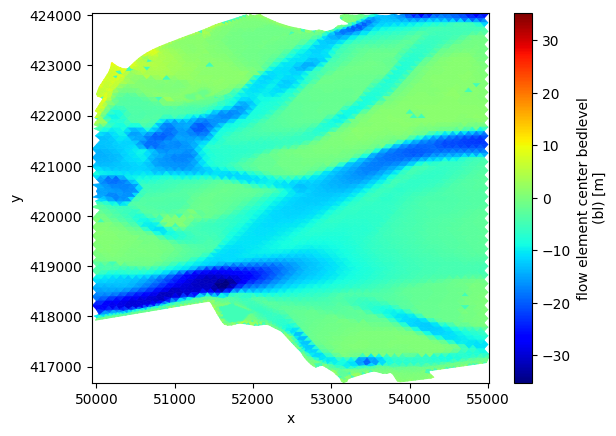
[14]:
# ugrid sel via x/y
uds_map_sel = uds_map.ugrid.sel(x=sel_slice_x,y=sel_slice_y)
fig, ax = plt.subplots()
pc = uds_map_sel['mesh2d_flowelem_bl'].ugrid.plot(ax=ax, linewidth=0.5, cmap='jet')
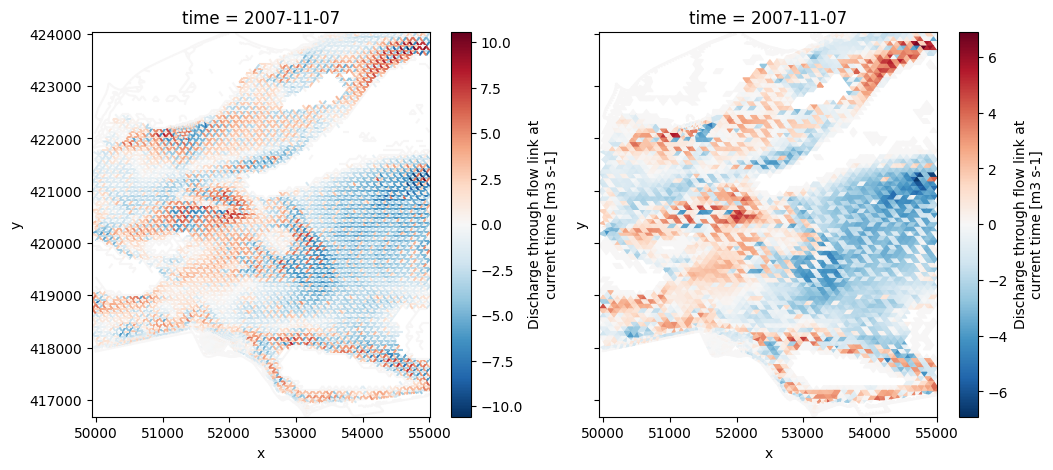
[15]:
# interpolate edge variable to faces
uda_edge = uds_map_sel['mesh2d_q1']
uda_face_int = dfmt.uda_to_faces(uda_edge)
uda_face = dfmt.uda_interfaces_to_centers(uda_face_int)

fig, (ax1,ax2) = plt.subplots(1,2,figsize=(12,5),sharex=True,sharey=True)
uda_edge.isel(time=-1, mesh2d_nLayers=layer, nmesh2d_layer=layer, missing_dims='ignore').ugrid.plot(ax=ax1)
uda_face.isel(time=-1, mesh2d_nLayers=layer, nmesh2d_layer=layer, missing_dims='ignore').ugrid.plot(ax=ax2)
edge-to-face interpolation: 0.06 sec
no interface dimension found, returning original array
[15]:
<matplotlib.collections.PolyCollection at 0x188f6596240>
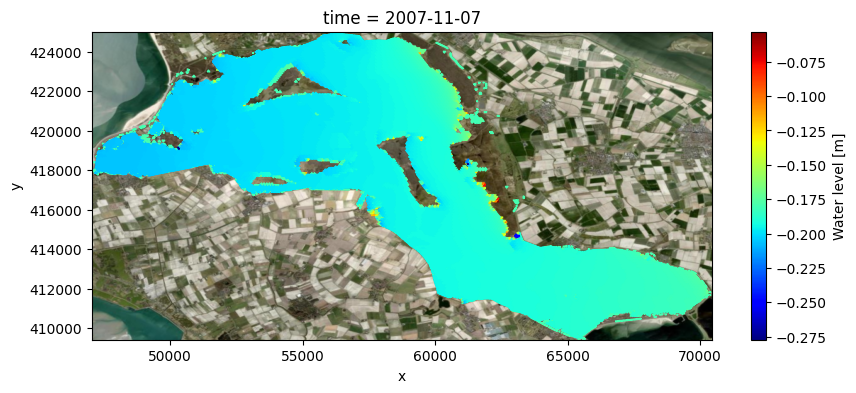
[16]:
# filter dry cells
bool_drycells = uds_map['mesh2d_s1']==uds_map['mesh2d_flowelem_bl']
uds_map['mesh2d_s1_filt'] = uds_map['mesh2d_s1'].where(~bool_drycells)

# plot water level on map
fig, ax = plt.subplots(figsize=(10,4))
pc = uds_map['mesh2d_s1_filt'].isel(time=-1).ugrid.plot(cmap='jet')
if crs is None:
    ax.set_aspect('equal')
else:
    ctx.add_basemap(ax=ax, source=ctx.providers.Esri.WorldImagery, crs=crs, attribution=False)
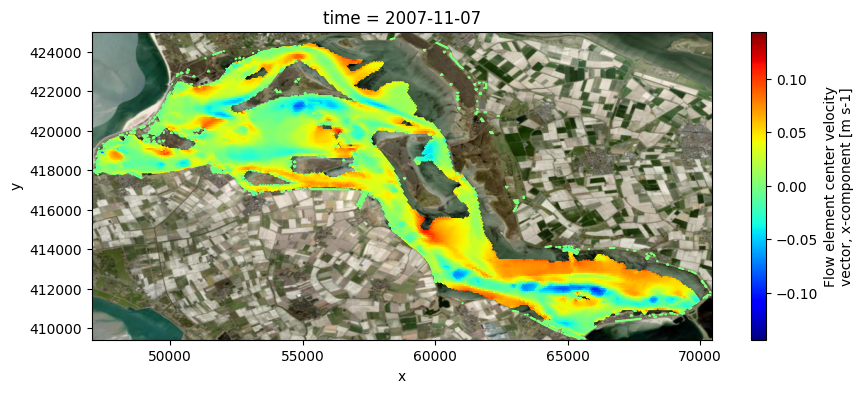
[17]:
# plot eastward velocities on map, on layer
fig, ax = plt.subplots(figsize=(10,4))
pc = uds_map['mesh2d_ucx'].isel(time=-1, mesh2d_nLayers=layer, nmesh2d_layer=layer, missing_dims='ignore').ugrid.plot(cmap='jet')
if crs is None:
    ax.set_aspect('equal')
else:
    ctx.add_basemap(ax=ax, source=ctx.providers.Esri.WorldImagery, crs=crs, attribution=False)
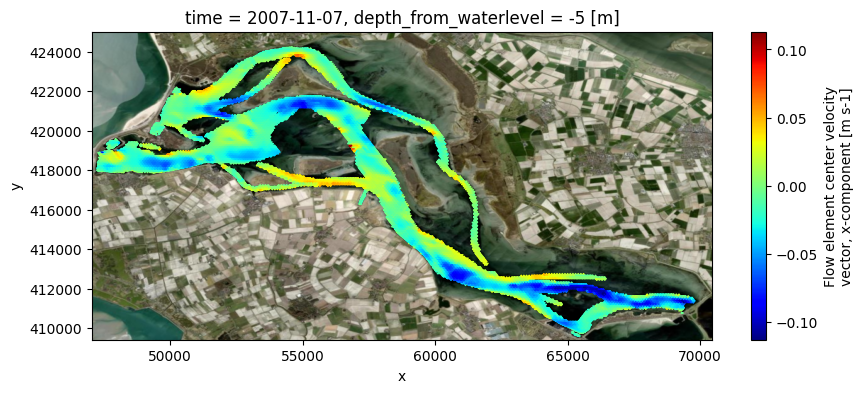
[18]:
# plot eastward velocities on map, on depth from waterlevel/z0/bedlevel
uds_map_atdepths = dfmt.get_Dataset_atdepths(data_xr=uds_map.isel(time=-1), depths=-5, reference='waterlevel')
fig, ax = plt.subplots(figsize=(10,4))
pc = uds_map_atdepths['mesh2d_ucx'].ugrid.plot(cmap='jet')
if crs is None:
    ax.set_aspect('equal')
else:
    ctx.add_basemap(ax=ax, source=ctx.providers.Esri.WorldImagery, crs=crs, attribution=False)
z-layer model, computing zw/zcc (fullgrid) values and treat as fullgrid model from here
0.23 sectting data on fixed depth in fullgrid z-data:
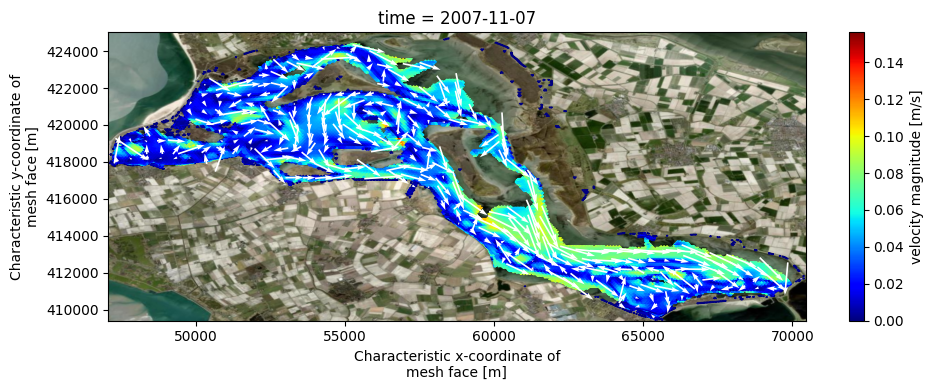
[19]:
# velocity magnitude and quiver
uds_quiv = uds_map.isel(time=-1, mesh2d_nLayers=-2, nmesh2d_layer=-2, missing_dims='ignore')
varn_ucx, varn_ucy = 'mesh2d_ucx', 'mesh2d_ucy'
magn_attrs = {'long_name':'velocity magnitude', 'units':'m/s'}
uds_quiv['magn'] = np.sqrt(uds_quiv[varn_ucx]**2 + uds_quiv[varn_ucy]**2).assign_attrs(magn_attrs)
raster_quiv = dfmt.rasterize_ugrid(uds_quiv[[varn_ucx,varn_ucy]], resolution=raster_res)

# plot
fig,ax = plt.subplots(figsize=(10,4))
pc = uds_quiv['magn'].ugrid.plot(cmap='jet')
raster_quiv.plot.quiver(x='mesh2d_face_x', y='mesh2d_face_y', u=varn_ucx, v=varn_ucy, color='w', scale=scale, add_guide=False)
fig.tight_layout()
if crs is None:
    ax.set_aspect('equal')
else:
    ctx.add_basemap(ax=ax, source=ctx.providers.Esri.WorldImagery, crs=crs, attribution=False)
>> rasterizing ugrid Dataset with 2 face variables to shape=(31,47): 0.02 sec
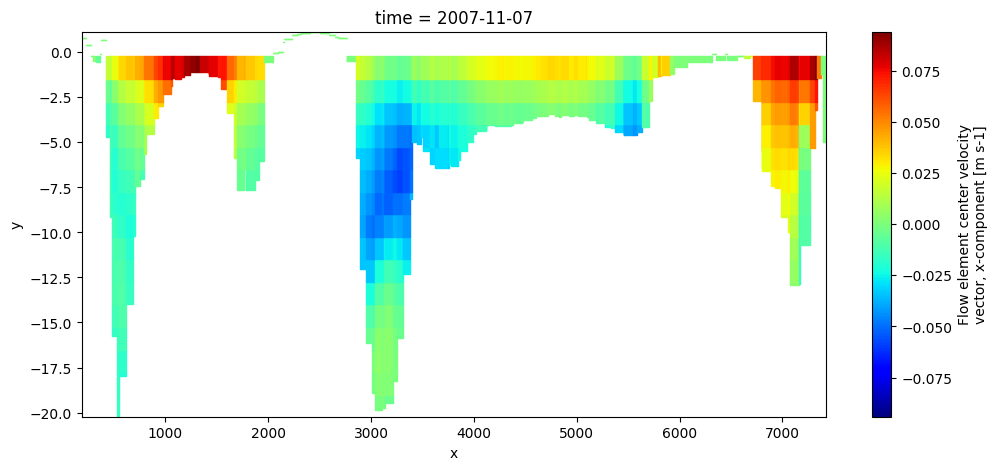
[20]:
# plot slice/sideview trough 3D velocity mapdata
uds_crs = dfmt.polyline_mapslice(uds_map.isel(time=-1), line_array)
fig,ax = plt.subplots(figsize=(12,5))
uds_crs['mesh2d_ucx'].ugrid.plot(cmap='jet')
z-layer model, computing zw/zcc (fullgrid) values and treat as fullgrid model from here
[20]:
<matplotlib.collections.PolyCollection at 0x188f5fd00b0>
[ ]: