Note
Go to the end to download the full example code
Basic Triangle Example#
In this example we’ll create some basic geometries and turn them into meshes. to illustrate some of the mesh generation features that Triangle provides in combination with polygon, point, and linestring geometries represented by geopandas.
import geopandas as gpd
import matplotlib.pyplot as plt
import numpy as np
import shapely.geometry as sg

import pandamesh as pm
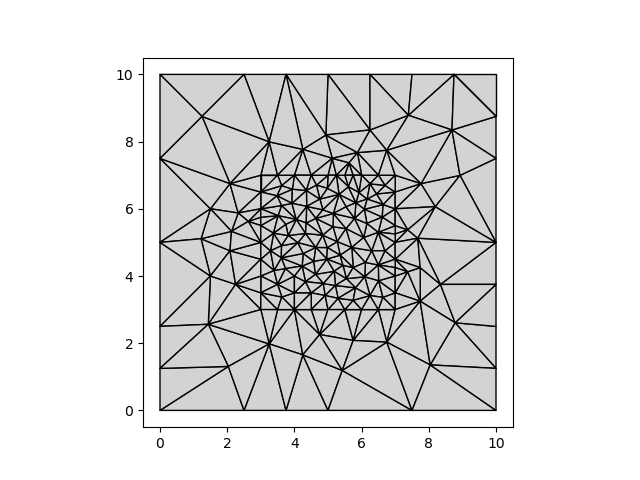
A simple rectangular mesh#
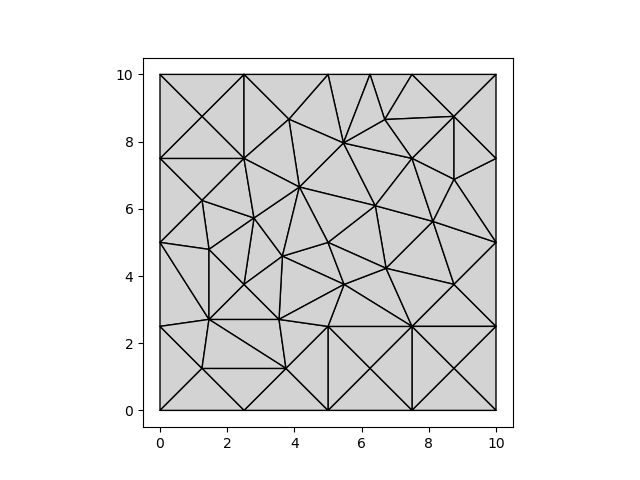
The most simple example is perhaps a rectangle. We’ll create a vector geometry, store this in a geodataframe, and associate a cell size.
polygon = sg.Polygon(
    [
        [0.0, 0.0],
        [10.0, 0.0],
        [10.0, 10.0],
        [0.0, 10.0],
    ]
)
gdf = gpd.GeoDataFrame(geometry=[polygon])
gdf["cellsize"] = 2.0
We’ll use this polygon to generate a mesh. We start by initializing a TriangleMesher, which is a simple wrapper around the Python bindings to the Triangle C-library. This wrapper extracts the coordinates and presents them in the appropriate manner for triangle.
mesher = pm.TriangleMesher(gdf)
vertices, triangles = mesher.generate()
pm.plot(vertices, triangles)
Defaults#
The TriangleMesher class is initialized with a number of default parameters:
print(mesher)
TriangleMesher
    vertices = np.ndarray with shape (4, 2)
    segments = np.ndarray with shape (4, 2)
    regions = np.ndarray with shape (1, 4)
    holes = None
    minimum_angle = 20.0
    conforming_delaunay = True
    suppress_exact_arithmetic = False
    maximum_steiner_points = None
    delaunay_algorithm = DelaunayAlgorithm.DIVIDE_AND_CONQUER
    consistency_check = False
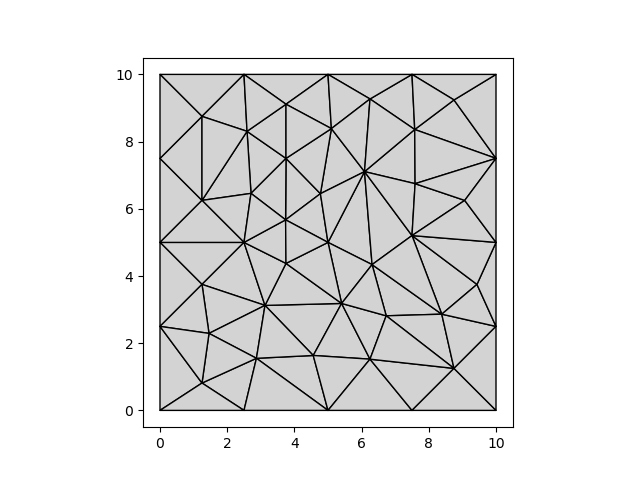
We can change a parameter, and see what effects this has on the mesh:
mesher.conforming_delaunay = False
vertices, triangles = mesher.generate()
pm.plot(vertices, triangles)
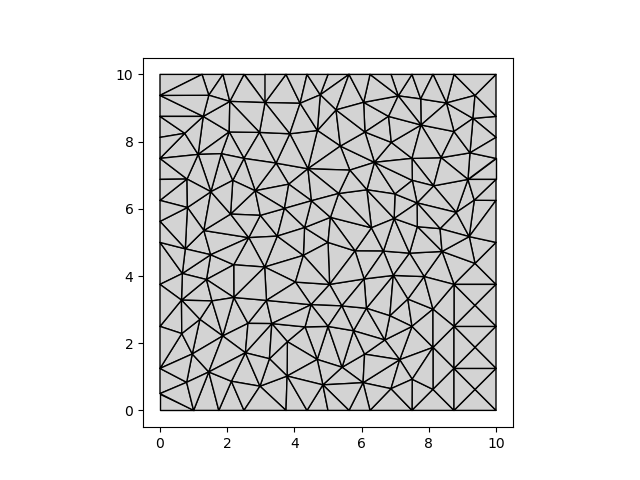
To generate a mesh with smaller cell sizes, we adjust the geodataframe, and recreate the mesher.
gdf["cellsize"] = 1.0
mesher = pm.TriangleMesher(gdf)
vertices, triangles = mesher.generate()
pm.plot(vertices, triangles)
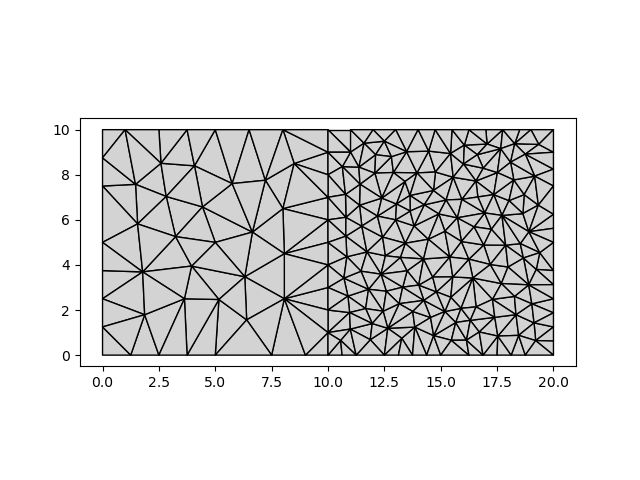
Multiple cell size zones#
Multiple zones of cell sizes are supported, as every polygon can be associated with a cell size in the geodataframe.
polygon2 = sg.Polygon(
    [
        [10.0, 0.0],
        [20.0, 0.0],
        [20.0, 10.0],
        [10.0, 10.0],
    ]
)
gdf = gpd.GeoDataFrame(geometry=[polygon, polygon2])
gdf["cellsize"] = [2.0, 1.0]

mesher = pm.TriangleMesher(gdf)
vertices, triangles = mesher.generate()
pm.plot(vertices, triangles)
Polygons with holes (“donut” geometries)#
Holes in polygons work as expected:
outer = [(0.0, 0.0), (10.0, 0.0), (10.0, 10.0), (0.0, 10.0)]
inner = [(3.0, 3.0), (7.0, 3.0), (7.0, 7.0), (3.0, 7.0)]

donut = sg.Polygon(shell=outer, holes=[inner])
gdf = gpd.GeoDataFrame(geometry=[donut])
gdf["cellsize"] = [2.0]

mesher = pm.TriangleMesher(gdf)
vertices, triangles = mesher.generate()
pm.plot(vertices, triangles)
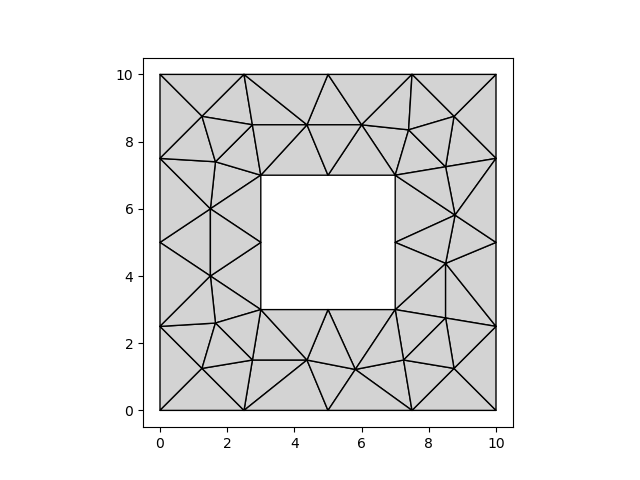
Local refinement#
To do local refinement, we need to ensure there is no overlap between the polygons. The coordinates of the hole of the outer polygon should match exactly with the coordinates of the exterior boundary of the inner polygon.
refined = sg.Polygon(inner)

gdf = gpd.GeoDataFrame(geometry=[donut, refined])
gdf["cellsize"] = [2.0, 0.5]

mesher = pm.TriangleMesher(gdf)
vertices, triangles = mesher.generate()
pm.plot(vertices, triangles)
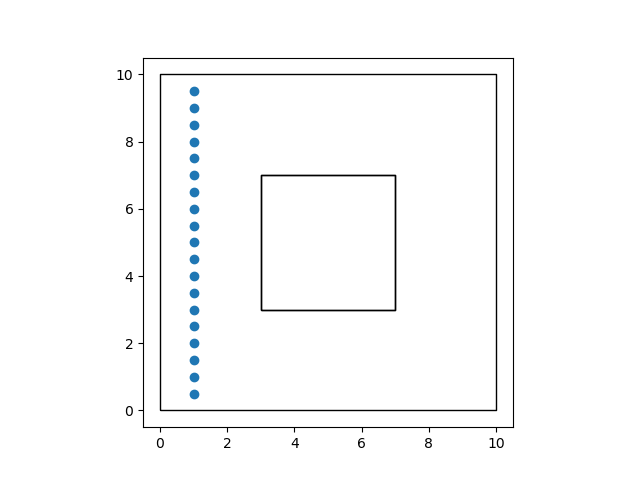
Force points into the triangulation#
We may also force points into the triangulation, by adding points to the geodataframe. Let’s assume we’d like to a series of points at x=1.0, at a distance of 0.5.
y = np.arange(0.5, 10.0, 0.5)
x = np.full(y.size, 1.0)
points = gpd.points_from_xy(x, y)

gdf = gpd.GeoDataFrame(geometry=[donut, refined, *points])
gdf["cellsize"] = [2.0, 0.5] + (len(points) * [np.nan])
gdf.plot(facecolor="none")
<Axes: >
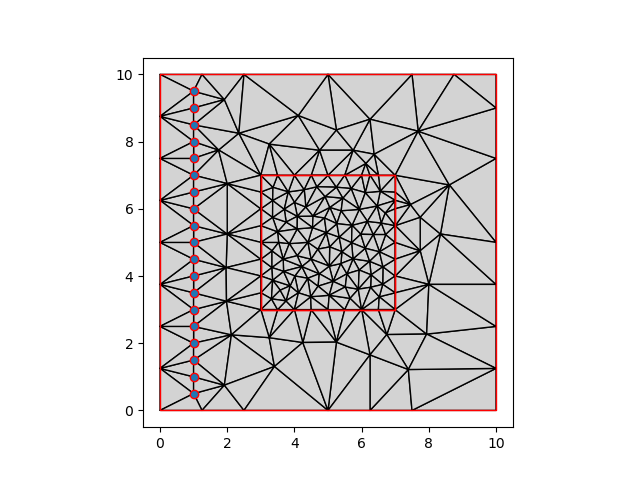
We can now see the points forced in the triangulation, by plotting the contents of the geodataframe on top of the generated mesh:
mesher = pm.TriangleMesher(gdf)
vertices, triangles = mesher.generate()

fig, ax = plt.subplots()
pm.plot(vertices, triangles, ax=ax)
gdf.plot(facecolor="none", edgecolor="red", ax=ax)
<Axes: >
Force linestrings into the triangulation#
We may do the same with linestrings. Here, we will add a vertical line at x = 9.0.
line = sg.LineString(
    [
        [9.0, 2.0],
        [9.0, 8.0],
    ]
)
gdf = gpd.GeoDataFrame(geometry=[donut, refined, line, *points])
gdf["cellsize"] = [2.0, 0.5, np.nan] + (len(points) * [np.nan])

mesher = pm.TriangleMesher(gdf)
vertices, triangles = mesher.generate()

fig, ax = plt.subplots()
pm.plot(vertices, triangles, ax=ax)
gdf.plot(facecolor="none", edgecolor="red", ax=ax)
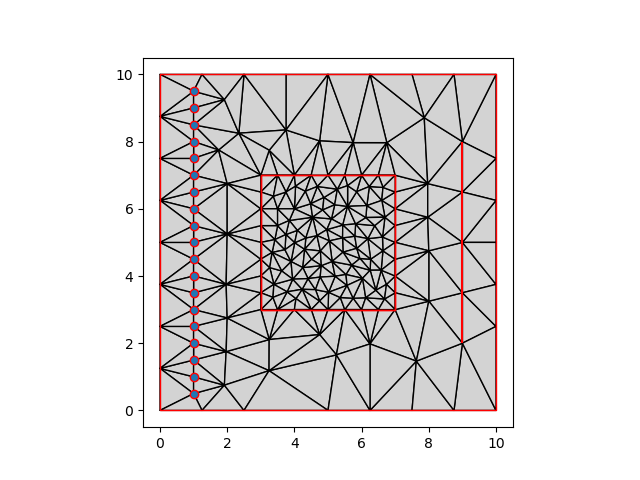
<Axes: >
Conclusion#
In real use, the vector geometries will be more complex, and not based on just a few coordinate pairs. Such cases are presented in the other examples, but the same principles apply: we may use polygons with associated cell sizes, and linestrings and points to steer the triangulation.
Total running time of the script: (0 minutes 0.948 seconds)