Note
Go to the end to download the full example code.
Preprocessing#
Raw geospatial vector data is often not ready to use directly in mesh generation:
Polygon data often do not form a valid planar partition: polygons are overlapping, or neighboring polygons have small gaps between them.
Polygon boundaries or linestring segments intersect each other.
Points may be located on polygon boundaries or lines. Since floating point numbers are not exact, points seemingly located on a line are computationally just left or just right of the line and form an extremely thin triangle.
Points may be located extremely close together, thereby generating tiny triangles.
Such problems either lead to a generated mesh with extremely small elements, or
worse, they lead to a crash of the meshing program. Pandamesh provides a
Preprocessor class to assist with cleaning up some common faults.
This example will illustrate some common problems and how to resolve them.
import geopandas as gpd
import matplotlib.pyplot as plt
import numpy as np
import shapely
import shapely.geometry as sg

import pandamesh as pm
Polygons#
When generating a mesh, we often have a general area which may be meshed coarsely and an area of interest, which should be meshed more finely. Generally, the fine inner zone is located within the coarse outer zone, but this requires a hole in the outer zone that exactly matches up with the exterior of the inner zone.
outer = sg.Polygon(
    [
        [0.0, 0.0],
        [10.0, 0.0],
        [10.0, 10.0],
        [0.0, 10.0],
    ]
)
inner = sg.Polygon(
    [
        [5.0, 2.0],
        [8.0, 5.0],
        [5.0, 8.0],
        [2.0, 5.0],
    ]
)

gdf = gpd.GeoDataFrame(geometry=[outer, inner])
gdf["cellsize"] = [2.0, 1.0]

fig, (ax0, ax1) = plt.subplots(ncols=2, sharex=True, sharey=True)
gdf.iloc[[0]].plot(ax=ax0)
gdf.iloc[[1]].plot(ax=ax1)
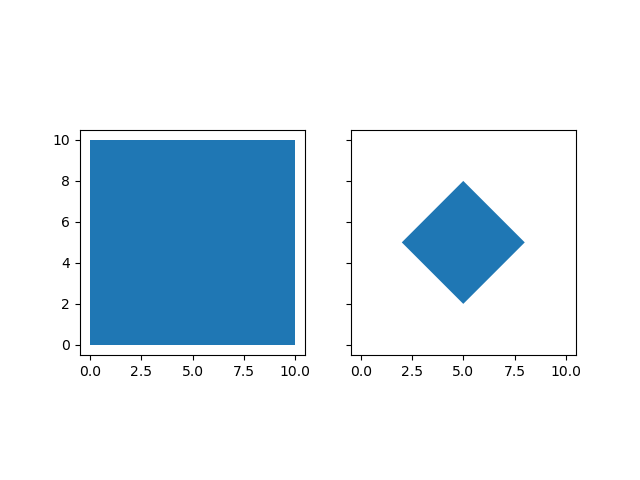
<Axes: >
In this case, we have two conflicting specified cell sizes in the inner square. We can resolve this as follows:
resolved = (
    pm.Preprocessor(geometry=gdf.geometry, values=gdf.cellsize)
    .unify_polygons()
    .to_geodataframe()
).rename(columns={"values": "cellsize"})
Note that the Preprocessor supports method chaining, allowing you to flexibly execute a set of operations.
The resulting geodataframe’s geometries are valid planar partition:
fig, (ax0, ax1) = plt.subplots(ncols=2, sharex=True, sharey=True)
resolved.iloc[[0]].plot(ax=ax0)
resolved.iloc[[1]].plot(ax=ax1)
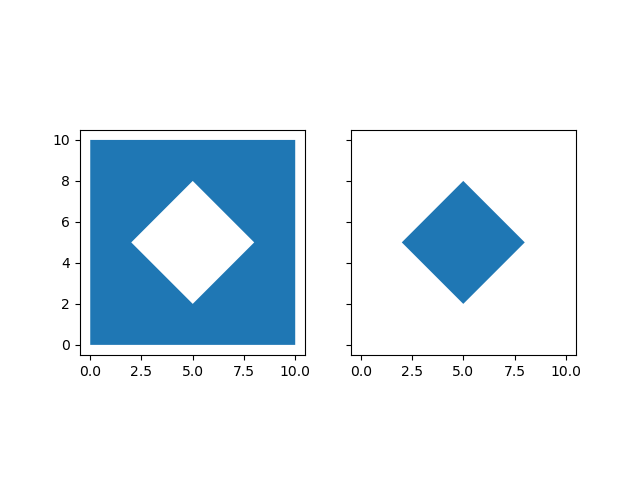
<Axes: >
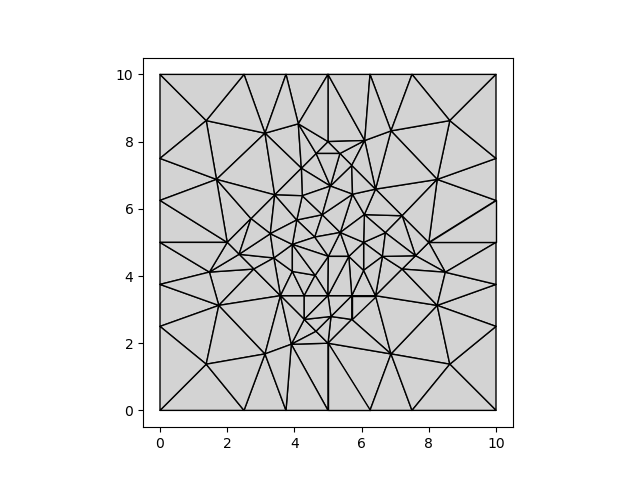
And we can use it directly to generate a mesh:
vertices, faces = pm.TriangleMesher(resolved).generate()
pm.plot(vertices, faces)
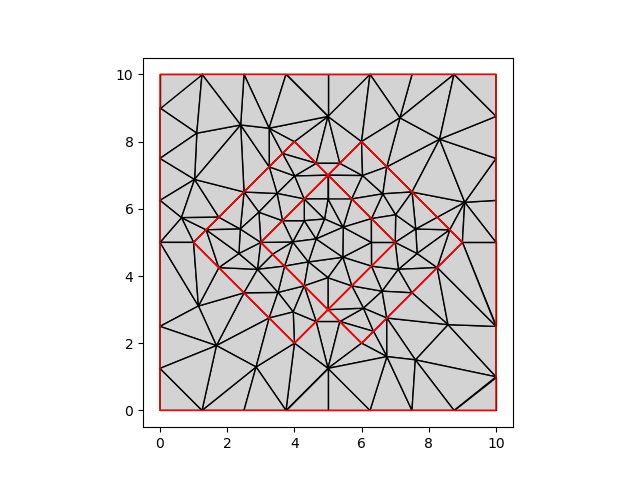
Alternatively, multiple polygons with the same cell size specification might be overlapping
inner0 = shapely.affinity.translate(inner, xoff=-1.0)
inner1 = shapely.affinity.translate(inner, xoff=1.0)
gdf = gpd.GeoDataFrame(geometry=[outer, inner0, inner1])
gdf["cellsize"] = [2.0, 1.0, 1.0]

fig, ax = plt.subplots()
gdf.plot(ax=ax, facecolor="none")
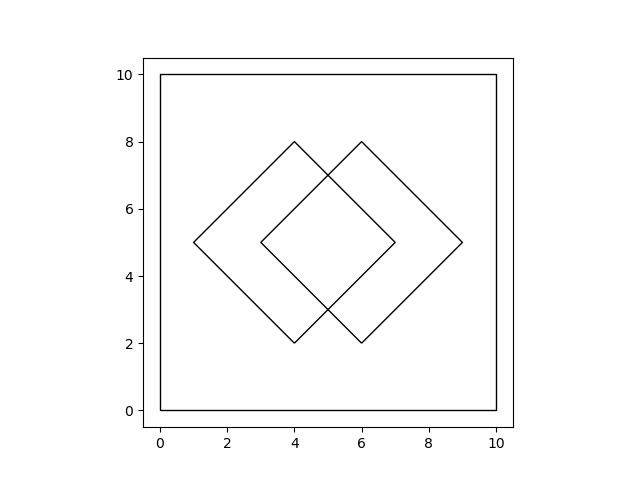
<Axes: >
These will also be resolved by .unify_polygons.
resolved = (
    pm.Preprocessor(geometry=gdf.geometry, values=gdf.cellsize)
    .unify_polygons()
    .to_geodataframe()
).rename(columns={"values": "cellsize"})

vertices, faces = pm.TriangleMesher(resolved).generate()

fig, ax = plt.subplots()
pm.plot(vertices, faces, ax=ax)
resolved.plot(ax=ax, facecolor="none", edgecolor="red")
<Axes: >
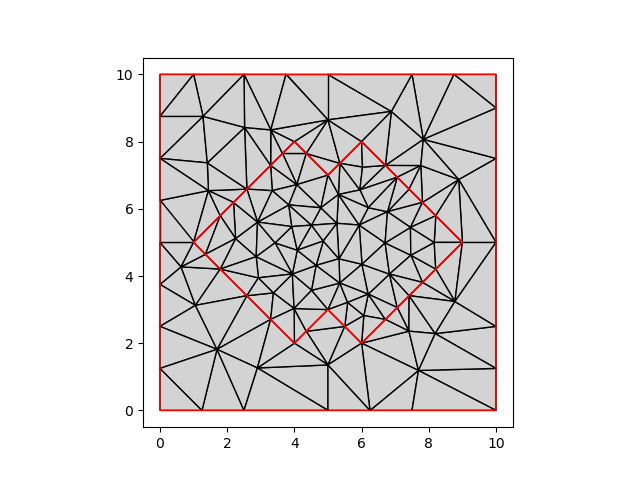
Note, however, that the internal boundaries of the inner polygons are forced
into the triangulation. We can rid of these by calling .merge_polygons:
resolved = (
    pm.Preprocessor(geometry=gdf.geometry, values=gdf.cellsize)
    .unify_polygons()
    .merge_polygons()
    .to_geodataframe()
).rename(columns={"values": "cellsize"})

vertices, faces = pm.TriangleMesher(resolved).generate()

fig, ax = plt.subplots()
pm.plot(vertices, faces, ax=ax)
resolved.plot(ax=ax, facecolor="none", edgecolor="red")
<Axes: >
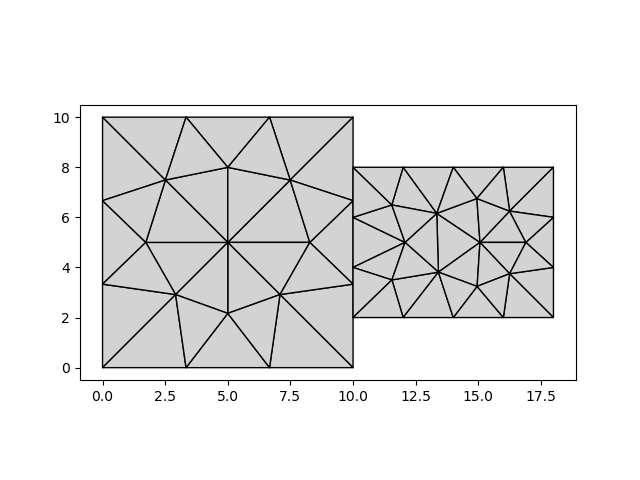
An alternative problem is when polygons are touching, but do not actually share vertices along the boundary.
first = sg.Polygon(
    [
        [0.0, 0.0],
        [10.0, 0.0],
        [10.0, 10.0],
        [0.0, 10.0],
    ]
)
second = sg.Polygon(
    [
        [10.0, 2.0],
        [18.0, 2.0],
        [18.0, 8.0],
        [10.0, 8.0],
    ]
)

gdf = gpd.GeoDataFrame(geometry=[first, second])
gdf["cellsize"] = [4.0, 2.0]

vertices, faces = pm.GmshMesher(gdf, intersecting_edges="warn").generate(finalize=True)
pm.plot(vertices, faces)
/home/runner/work/pandamesh/pandamesh/pandamesh/common.py:407: UserWarning: 2 unresolved intersections between polygon boundary or line segments.
Run pandamesh.find_edge_intersections(gdf.geometry) to identify the intersection locations.
Intersections can be resolved using the pandamesh.Preprocessor.
  warnings.warn(msg)
At x=10.0, the generated triangles are disconnected.
This is caused by the the fact that the polygons do not share an edge:
The polygon on the left has an edge from (10.0, 0.0) to (10.0, 10.0)
The polygon on the right has an edge from (10.0, 2.0) to (10.0, 8.0)
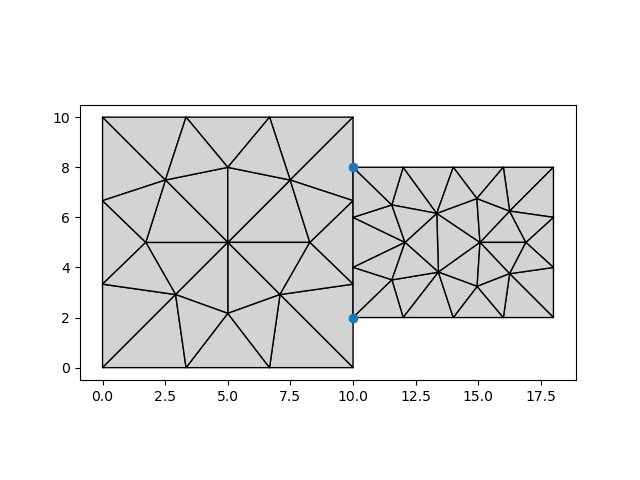
In fact, the vertices of the right polygon are intersecting the (edge) of the
left polygon. We can identify these intersections with
pandamesh.find_edge_intersections():
intersections = pm.find_edge_intersections(gdf.geometry)

fig, ax = plt.subplots()
pm.plot(vertices, faces, ax=ax)
intersections.plot(ax=ax)
<Axes: >
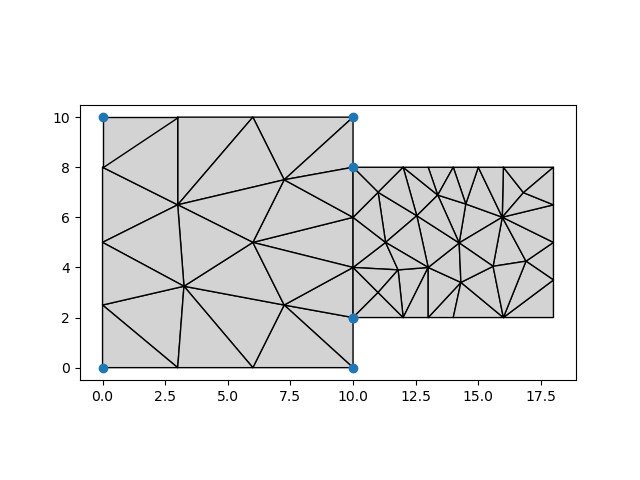
Calling .unify_polygons() ensures that the vertices of touching polygons
are inserted, such that the polygons share an edge.
resolved = (
    pm.Preprocessor(geometry=gdf.geometry, values=gdf.cellsize)
    .unify_polygons()
    .to_geodataframe()
).rename(columns={"values": "cellsize"})

vertices, faces = pm.TriangleMesher(resolved).generate()
polygon0_coords = shapely.get_coordinates(resolved.geometry[0])

fig, ax = plt.subplots()
pm.plot(vertices, faces, ax=ax)
ax.scatter(*polygon0_coords.T)
<matplotlib.collections.PathCollection object at 0x7ff32a8de390>
Lines#
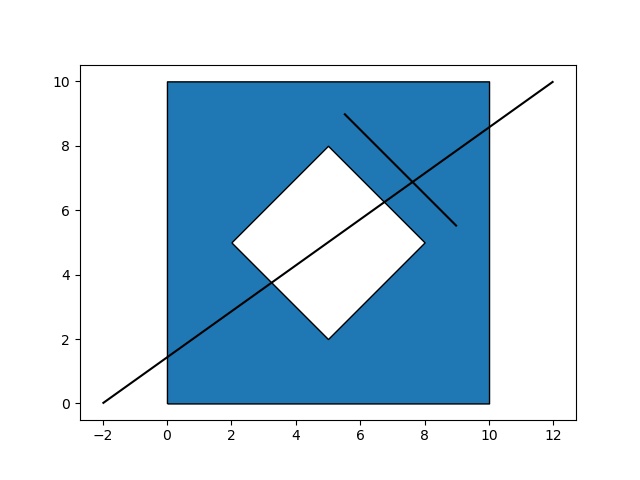
Lines may only be only partially present, or present in holes:
donut = sg.Polygon(
    [
        [0.0, 0.0],
        [10.0, 0.0],
        [10.0, 10.0],
        [0.0, 10.0],
    ],
    holes=[
        [
            [2.0, 5.0],
            [5.0, 8.0],
            [8.0, 5.0],
            [5.0, 2.0],
        ]
    ],
)
line0 = shapely.LineString(
    [
        [-2.0, 0.0],
        [12.0, 10.0],
    ]
)
line1 = shapely.LineString(
    [
        [5.5, 9.0],
        [9.0, 5.5],
    ]
)

gdf = gpd.GeoDataFrame(geometry=[donut, line0, line1])
gdf["cellsize"] = [2.0, 1.0, 1.0]
gdf.plot(edgecolor="k")
<Axes: >
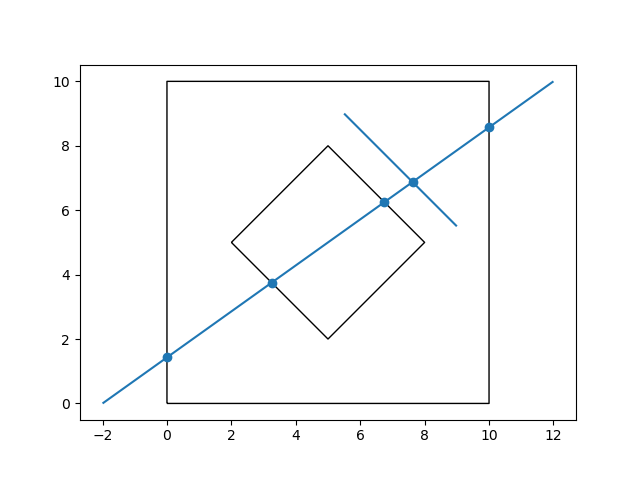
We can identify these problematic intersections again using
pandamesh.find_edge_intersections():
intersections = pm.find_edge_intersections(gdf.geometry)
fig, ax = plt.subplots()
gdf.plot(ax=ax, facecolor="none")
intersections.plot(ax=ax)
<Axes: >
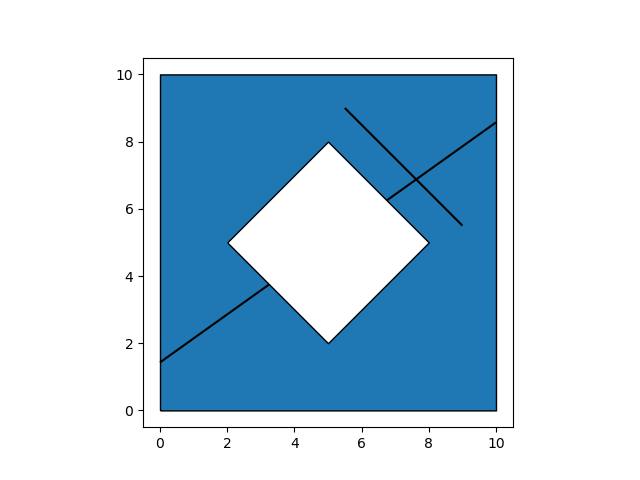
A first step is to remove line segments that do not fall in any polygon:
resolved = (
    pm.Preprocessor(geometry=gdf.geometry, values=gdf.cellsize)
    .clip_lines()
    .to_geodataframe()
).rename(columns={"values": "cellsize"})
resolved.plot(edgecolor="k")
<Axes: >
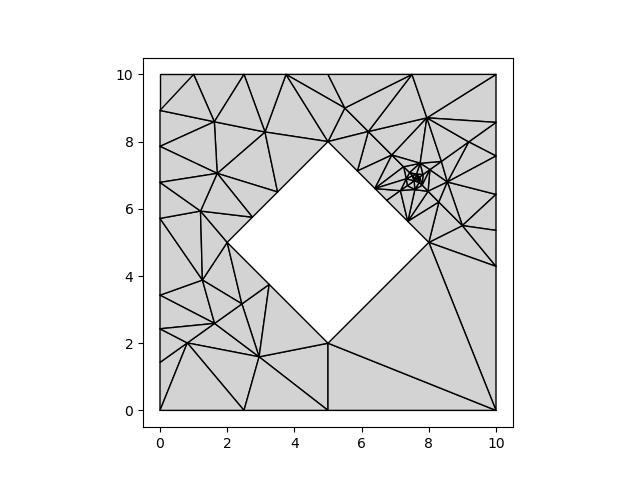
However, this doesn’t create suitable input for meshing. The GmshMesher
appears to hang on this input, and Triangle generates a grid with very small
triangles. Pandamesh errors on these intersections by default, but way may
proceed:
vertices, faces = pm.TriangleMesher(resolved, intersecting_edges="warn").generate()
pm.plot(vertices, faces)
/home/runner/work/pandamesh/pandamesh/pandamesh/common.py:407: UserWarning: 5 unresolved intersections between polygon boundary or line segments.
Run pandamesh.find_edge_intersections(gdf.geometry) to identify the intersection locations.
Intersections can be resolved using the pandamesh.Preprocessor.
  warnings.warn(msg)
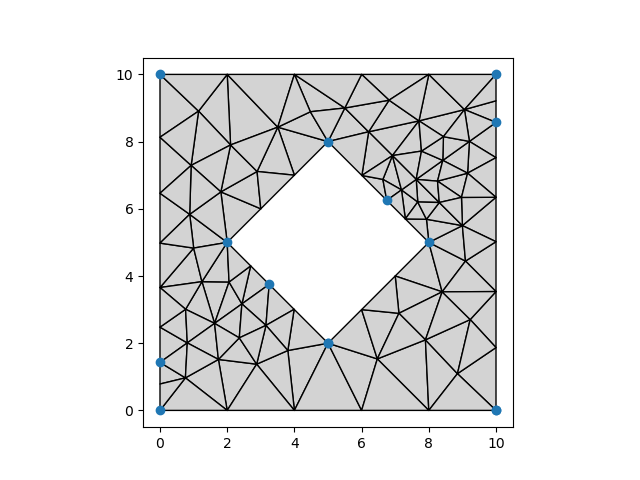
A better approach here is to ensure all intersections are present in all linework:
First we clip.
Then we call
unify_linesto ensure that the intersection of line0 and line1 at (7.625 6.875) is represented.Next we call
unify_polygons. This ensures the intersections of the lines with the poygon exterior is represented as well.The result of
unify_polygonsis that the line splits the polygon in two parts. These are merged back together withmerge_polygons.
If we plot the vertices of the resolved polygon, we see that the intersection vertices have been inserted into the polygon boundaries, and that the tiny triangles around the line intersection have disappeared:
resolved = (
    pm.Preprocessor(geometry=gdf.geometry, values=gdf.cellsize)
    .clip_lines()
    .unify_lines()
    .unify_polygons()
    .merge_polygons()
    .to_geodataframe()
).rename(columns={"values": "cellsize"})

vertices, faces = pm.GmshMesher(resolved).generate(finalize=True)
polygon0_coords = shapely.get_coordinates(resolved.geometry[0])

fig, ax = plt.subplots()
pm.plot(vertices, faces, ax=ax)
ax.scatter(*polygon0_coords.T)
<matplotlib.collections.PathCollection object at 0x7ff32a6196d0>
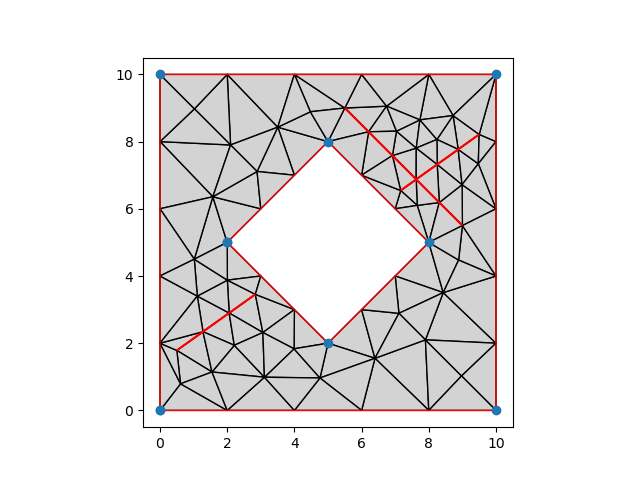
In some cases, having line segments terminate exactly on polygon boundaries
still causes trouble. We may also ensure that lines are some distance removed
from any polygon boundary by providing a distance to clip_lines:
resolved = (
    pm.Preprocessor(geometry=gdf.geometry, values=gdf.cellsize)
    .unify_lines()
    .clip_lines(distance=0.5)
    .to_geodataframe()
).rename(columns={"values": "cellsize"})

vertices, faces = pm.GmshMesher(resolved).generate(finalize=True)
polygon0_coords = shapely.get_coordinates(resolved.geometry[0])

fig, ax = plt.subplots()
pm.plot(vertices, faces, ax=ax)
resolved.plot(facecolor="none", edgecolor="red", ax=ax)
ax.scatter(*polygon0_coords.T)
<matplotlib.collections.PathCollection object at 0x7ff3375d0ef0>
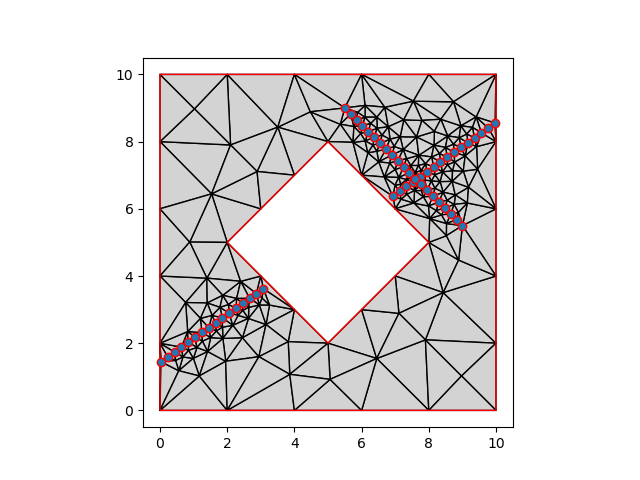
Another pragmatic approach is to convert any line into interpolated points. Points cannot intersect each other, which sidesteps a large number of problems.
resolved = (
    pm.Preprocessor(geometry=gdf.geometry, values=gdf.cellsize)
    .interpolate_lines_to_points(distance=0.25)
    .clip_points()
    .to_geodataframe()
).rename(columns={"values": "cellsize"})

vertices, faces = pm.GmshMesher(resolved).generate(finalize=True)

fig, ax = plt.subplots()
pm.plot(vertices, faces, ax=ax)
resolved.plot(facecolor="none", edgecolor="red", ax=ax)
<Axes: >
Points#
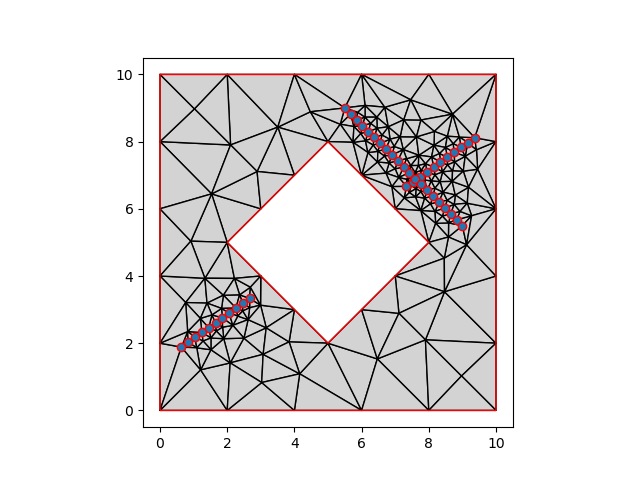
Note that the start and end points of the lines are still on, or very near the polygon edges.
We can remove those points by providing a distance to clip_points.
resolved = (
    pm.Preprocessor(geometry=gdf.geometry, values=gdf.cellsize)
    .interpolate_lines_to_points(distance=0.25)
    .clip_points(distance=0.5)
    .to_geodataframe()
).rename(columns={"values": "cellsize"})

vertices, faces = pm.GmshMesher(resolved).generate(finalize=True)

fig, ax = plt.subplots()
pm.plot(vertices, faces, ax=ax)
resolved.plot(facecolor="none", edgecolor="red", ax=ax)
<Axes: >
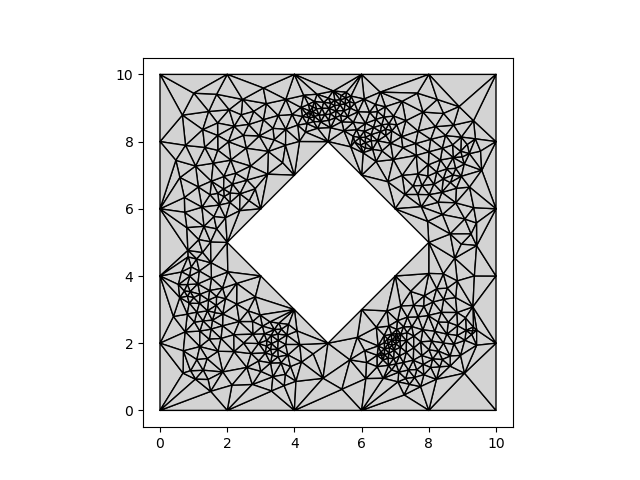
A problem with points is that they may be very close together, thereby generating very small triangles. Let’s generate 200 random points to illustrate:
rng = np.random.default_rng()
points = gpd.points_from_xy(*rng.random((2, 200)) * 10.0)
gdf = gpd.GeoDataFrame(geometry=np.concatenate([[donut], points]))
gdf["cellsize"] = 2.0

resolved = (
    pm.Preprocessor(geometry=gdf.geometry, values=gdf.cellsize)
    .clip_points(distance=0.5)
    .to_geodataframe()
).rename(columns={"values": "cellsize"})

vertices, faces = pm.GmshMesher(resolved).generate(finalize=True)
pm.plot(vertices, faces)
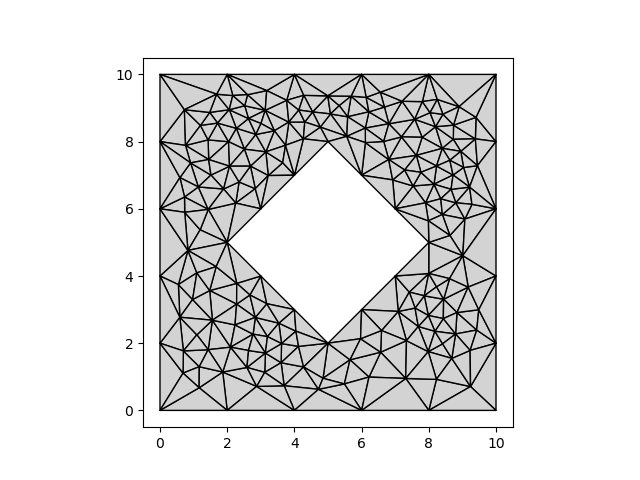
We can solve this by snapping points together that are located some distance from each other:
resolved = (
    pm.Preprocessor(geometry=gdf.geometry, values=gdf.cellsize)
    .clip_points(distance=0.5)
    .snap_points(distance=0.5)
    .to_geodataframe()
).rename(columns={"values": "cellsize"})

vertices, faces = pm.GmshMesher(resolved).generate(finalize=True)
pm.plot(vertices, faces)
Flexibility and composability#
The Preprocessor class in Pandamesh is designed with flexibility and composability in mind through method chaining. By combining various preprocessing steps in any order, you can address a wide range of geometric issues. For instance, you might start by unifying polygons, then clip lines, interpolate them to points, and finally snap those points together.
The steps required depend on the nature of geometrical input, and may require
experimenting with various methods. The intermediate output can be checked
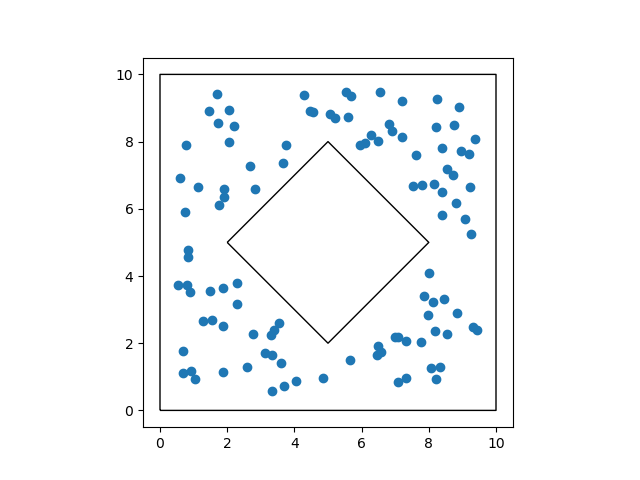
and visualized at any moments, by calling to_geodataframe. For example,
to check the intermediate result after clipping but prior to snapping:
check = (
    pm.Preprocessor(geometry=gdf.geometry, values=gdf.cellsize)
    .clip_points(distance=0.5)
    .to_geodataframe()
)

check.plot(facecolor="none")
<Axes: >
This also makes it easy to apply the preprocessor in steps. Some steps may be relatively costly, such as unifying a large number of detailed polygons. The intermediate result can be stored as e.g. a GeoPackage. Then, in a separate processing step, the intermediate result can be read again, and other processing steps (such as filtering points) can be applied.
Total running time of the script: (0 minutes 1.469 seconds)