Tip
Example: Reading raster data#
This example illustrates the how to read raster data using the HydroMT DataCatalog with the raster, netcdf and raster_tindex drivers.
[1]:
# import hydromt and setup logging
import hydromt
from hydromt.log import setuplog

logger = setuplog("read raster data", log_level=10)
2022-10-24 08:06:44,300 - read raster data - log - INFO - HydroMT version: 0.6.0
[2]:
# Download artifacts for the Piave basin to `~/.hydromt_data/`.
data_catalog = hydromt.DataCatalog(logger=logger)
data_catalog.from_predefined_catalogs('artifact_data')
2022-10-24 08:06:44,346 - read raster data - data_catalog - INFO - Reading data catalog artifact_data v0.0.6 from archive
2022-10-24 08:06:44,347 - read raster data - data_catalog - INFO - Parsing data catalog from /home/runner/.hydromt_data/artifact_data/v0.0.6/data_catalog.yml
Raster driver#
To read raster data and parse it into a xarray Dataset or DataArray we use the open_mfraster() method. All kwargs in the data catalog yaml file will be passed to this method. The raster driver supports all GDAL data formats, including the often used GeoTiff of Cloud Optimized GeoTiff (COG) formats. Tiled datasets can also
be passed as a virtual raster tileset (vrt) file.
As an example we will use the MERIT Hydro dataset which is set of GeoTiff files with identical grids, one for each variable of the datasets.
[3]:
# inspect data source entry in data catalog yaml file
data_catalog["merit_hydro"]
[3]:
crs: 4326
data_type: RasterDataset
driver: raster
meta:
  category: topography
  paper_doi: 10.1029/2019WR024873
  paper_ref: Yamazaki et al. (2019)
  source_license: CC-BY-NC 4.0 or ODbL 1.0
  source_url: http://hydro.iis.u-tokyo.ac.jp/~yamadai/MERIT_Hydro
  source_version: 1.0
path: /home/runner/.hydromt_data/artifact_data/v0.0.6/merit_hydro/{variable}.tif
We can load any RasterDataset using DataCatalog.get_rasterdataset(). Note that if we don’t provide any arguments it returns the full dataset with nine data variables and for the full spatial domain. Only the data coordinates are actually read, the data variables are still lazy Dask arrays.
[4]:
ds = data_catalog.get_rasterdataset("merit_hydro")
ds
2022-10-24 08:06:44,438 - read raster data - data_catalog - INFO - DataCatalog: Getting merit_hydro RasterDataset raster data from /home/runner/.hydromt_data/artifact_data/v0.0.6/merit_hydro/{variable}.tif
[4]:
<xarray.Dataset>
Dimensions:      (x: 1680, y: 1920)
Coordinates:
  * x            (x) float64 11.6 11.6 11.6 11.6 11.6 ... 13.0 13.0 13.0 13.0
  * y            (y) float64 46.8 46.8 46.8 46.8 46.8 ... 45.2 45.2 45.2 45.2
    spatial_ref  int64 0
Data variables:
    rivwth       (y, x) float32 dask.array<chunksize=(1920, 1680), meta=np.ndarray>
    flwdir       (y, x) uint8 dask.array<chunksize=(1920, 1680), meta=np.ndarray>
    basins       (y, x) uint32 dask.array<chunksize=(1920, 1680), meta=np.ndarray>
    upgrid       (y, x) int32 dask.array<chunksize=(1920, 1680), meta=np.ndarray>
    elevtn       (y, x) float32 dask.array<chunksize=(1920, 1680), meta=np.ndarray>
    hnd          (y, x) float32 dask.array<chunksize=(1920, 1680), meta=np.ndarray>
    lndslp       (y, x) float32 dask.array<chunksize=(1920, 1680), meta=np.ndarray>
    uparea       (y, x) float32 dask.array<chunksize=(1920, 1680), meta=np.ndarray>
    strord       (y, x) uint8 dask.array<chunksize=(1920, 1680), meta=np.ndarray>
Attributes:
    category:        topography
    paper_doi:       10.1029/2019WR024873
    paper_ref:       Yamazaki et al. (2019)
    source_license:  CC-BY-NC 4.0 or ODbL 1.0
    source_url:      http://hydro.iis.u-tokyo.ac.jp/~yamadai/MERIT_Hydro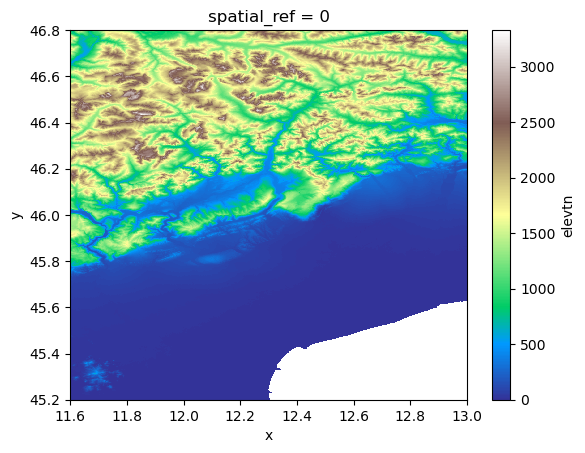
source_version: 1.0The data can be visualized with the .plot() xarray method. We replace all nodata values with NaNs with .raster.mask_nodata().
[5]:
ds["elevtn"].raster.mask_nodata().plot(cmap="terrain")
[5]:
<matplotlib.collections.QuadMesh at 0x7fa72d698610>
We can request a (spatial) subset data by providing additional variables and bbox / geom arguments. Note that these return a smaller spatial extent and just two data variables. The variables argument is especially useful if each variable of the dataset is saved in a separate file and the {variable} key is used in the path argument of the data source (see above) to limit which files are actually read. If a single variable is requested a DataArray instead of a Dataset is returned
unless the single_var_as_array argument is set to False (True by default).
[6]:
bbox = [11.70, 45.35, 12.95, 46.70]
ds = data_catalog.get_rasterdataset(
    "merit_hydro", bbox=bbox, variables=["elevtn"], single_var_as_array=True
)
ds
2022-10-24 08:06:48,088 - read raster data - data_catalog - INFO - DataCatalog: Getting merit_hydro RasterDataset raster data from /home/runner/.hydromt_data/artifact_data/v0.0.6/merit_hydro/{variable}.tif
2022-10-24 08:06:48,107 - read raster data - rasterdataset - DEBUG - RasterDataset: Clip with bbox - [11.700, 45.350, 12.950, 46.700]
[6]:
<xarray.DataArray 'elevtn' (y: 1620, x: 1500)>
dask.array<getitem, shape=(1620, 1500), dtype=float32, chunksize=(1620, 1500), chunktype=numpy.ndarray>
Coordinates:
  * x            (x) float64 11.7 11.7 11.7 11.7 ... 12.95 12.95 12.95 12.95
  * y            (y) float64 46.7 46.7 46.7 46.7 ... 45.35 45.35 45.35 45.35
    spatial_ref  int64 0
Attributes:
    AREA_OR_POINT:   Area
    _FillValue:      -9999.0
    source_file:     elevtn.tif
    category:        topography
    paper_doi:       10.1029/2019WR024873
    paper_ref:       Yamazaki et al. (2019)
    source_license:  CC-BY-NC 4.0 or ODbL 1.0
    source_url:      http://hydro.iis.u-tokyo.ac.jp/~yamadai/MERIT_Hydro
source_version: 1.0As mentioned earlier, all kwargs in the data entry of the catalog yaml file will be passed to the open_mfraster() method. Here we show how these arguments can be used to concatenate multiple raster files along a new dimension.
[7]:
# update data source entry (this is normally done manually before initializing the data catalog!)
data_catalog["merit_hydro"].kwargs.update(concat_dim="variable", concat=True)
data_catalog["merit_hydro"]
[7]:
crs: 4326
data_type: RasterDataset
driver: raster
kwargs:
  concat: true
  concat_dim: variable
meta:
  category: topography
  paper_doi: 10.1029/2019WR024873
  paper_ref: Yamazaki et al. (2019)
  source_license: CC-BY-NC 4.0 or ODbL 1.0
  source_url: http://hydro.iis.u-tokyo.ac.jp/~yamadai/MERIT_Hydro
  source_version: 1.0
path: /home/runner/.hydromt_data/artifact_data/v0.0.6/merit_hydro/{variable}.tif
[8]:
# this returns a DataArray (single variable) with a new 'variable' dimension
da = data_catalog.get_rasterdataset("merit_hydro")
da
2022-10-24 08:06:48,140 - read raster data - data_catalog - INFO - DataCatalog: Getting merit_hydro RasterDataset raster data from /home/runner/.hydromt_data/artifact_data/v0.0.6/merit_hydro/{variable}.tif
[8]:
<xarray.DataArray 'rivwth' (variable: 9, y: 1920, x: 1680)>
dask.array<concatenate, shape=(9, 1920, 1680), dtype=float64, chunksize=(1, 1920, 1680), chunktype=numpy.ndarray>
Coordinates:
  * x            (x) float64 11.6 11.6 11.6 11.6 11.6 ... 13.0 13.0 13.0 13.0
  * y            (y) float64 46.8 46.8 46.8 46.8 46.8 ... 45.2 45.2 45.2 45.2
  * variable     (variable) int64 0 1 2 3 4 5 6 7 8
    spatial_ref  int64 0
Attributes:
    AREA_OR_POINT:   Area
    _FillValue:      -9999.0
    category:        topography
    paper_doi:       10.1029/2019WR024873
    paper_ref:       Yamazaki et al. (2019)
    source_license:  CC-BY-NC 4.0 or ODbL 1.0
    source_url:      http://hydro.iis.u-tokyo.ac.jp/~yamadai/MERIT_Hydro
source_version: 1.0TIP: To write a dataset back to a stack of raster in a single folder use the .raster.to_mapstack() method.
Netcdf driver#
Many gridded datasets with a third dimension (e.g. time) are saved in netcdf or zarr files, which can be read with the netcdf and zarr drivers respectively. This data is read using the xarray.open_mfdataset() method. These formats are flexible and therefore HydroMT is not always able to read the geospatial attributes such as the CRS from the data and it has to be set through the data catalog yaml file.
If the data is stored per year or month, the {year} and {month} keys can be used in the path argument of a data source in the data catalog yaml file to speed up the reading of a temporal subset of the data using the date_tuple argument of DataCatalog.get_rasterdataset() (not in this example).
As example we use the ERA5 dataset.
[9]:
# Note the crs argument as this is missing in the original data
data_catalog["era5_hourly"]
[9]:
crs: 4326
data_type: RasterDataset
driver: netcdf
meta:
  category: meteo
  history: Extracted from Copernicus Climate Data Store
  paper_doi: 10.1002/qj.3803
  paper_ref: Hersbach et al. (2019)
  source_license: https://cds.climate.copernicus.eu/cdsapp/#!/terms/licence-to-use-copernicus-products
  source_url: https://doi.org/10.24381/cds.bd0915c6
  source_version: ERA5 hourly data on pressure levels
path: /home/runner/.hydromt_data/artifact_data/v0.0.6/era5_hourly.nc
unit_add:
  temp: -273.15
unit_mult:
  kin: 0.000277778
  kout: 0.000277778
  precip: 1000
  press_msl: 0.01
[10]:
# Note that the some units are converted
ds = data_catalog.get_rasterdataset("era5_hourly")
ds
2022-10-24 08:06:48,296 - read raster data - data_catalog - INFO - DataCatalog: Getting era5_hourly RasterDataset netcdf data from /home/runner/.hydromt_data/artifact_data/v0.0.6/era5_hourly.nc
2022-10-24 08:06:48,322 - read raster data - rasterdataset - DEBUG - RasterDataset: Convert units for 5 variables.
[10]:
<xarray.Dataset>
Dimensions:      (longitude: 6, latitude: 7, time: 336)
Coordinates:
  * longitude    (longitude) float32 11.75 12.0 12.25 12.5 12.75 13.0
  * latitude     (latitude) float32 46.75 46.5 46.25 46.0 45.75 45.5 45.25
  * time         (time) datetime64[ns] 2010-02-01 ... 2010-02-14T23:00:00
    spatial_ref  int32 ...
Data variables:
    press_msl    (time, latitude, longitude) float32 dask.array<chunksize=(336, 7, 6), meta=np.ndarray>
    kin          (time, latitude, longitude) float32 dask.array<chunksize=(336, 7, 6), meta=np.ndarray>
    temp         (time, latitude, longitude) float32 dask.array<chunksize=(336, 7, 6), meta=np.ndarray>
    kout         (time, latitude, longitude) float32 dask.array<chunksize=(336, 7, 6), meta=np.ndarray>
    precip       (time, latitude, longitude) float32 dask.array<chunksize=(336, 7, 6), meta=np.ndarray>
Attributes:
    Conventions:     CF-1.6
    history:         Extracted from Copernicus Climate Data Store
    category:        meteo
    paper_doi:       10.1002/qj.3803
    paper_ref:       Hersbach et al. (2019)
    source_license:  https://cds.climate.copernicus.eu/cdsapp/#!/terms/licenc...
    source_url:      https://doi.org/10.24381/cds.bd0915c6
source_version: ERA5 hourly data on pressure levelsRaster_tindex driver#
If the raster data is tiled but for each tile a different CRS is used (for instance a different UTM projection for each UTM zone), this dataset cannot be described using a VRT file. In this case a vector file can be build to use a raster tile index using gdaltindex and read using open_raster_from_tindex(). To read the data into a single xarray.Dataset the data needs to be reprojected
and mosaiced to a single CRS while reading. As this type of data cannot be loaded lazily the method is typically used with an area of interest for which the data is loaded and combined.
As example we use the GRWL mask raster tiles for which we have created a tileindex using the aforementioned gdaltindex command line tool. Note that the path points to the GeoPackage output of the gdaltindex tool.
[11]:
data_catalog["grwl_mask"]
[11]:
data_type: RasterDataset
driver: raster_tindex
kwargs:
  chunks:
    x: 3000
    y: 3000
  mosaic_kwargs:
    method: nearest
  tileindex: location
meta:
  paper_doi: 10.1126/science.aat0636
  paper_ref: Allen and Pavelsky (2018)
  source_license: CC BY 4.0
  source_url: https://doi.org/10.5281/zenodo.1297434
  source_version: 1.01
nodata: 0
path: /home/runner/.hydromt_data/artifact_data/v0.0.6/grwl_tindex.gpkg
[12]:
# the tileindex is a GeoPackage vector file
# with an attribute column 'location' (see also the tileindex argument under kwargs) containing the (relative) paths to the raster file data
import geopandas as gpd

fn_tindex = data_catalog["grwl_mask"].path
print(fn_tindex)
gpd.read_file(fn_tindex, rows=5)
/home/runner/.hydromt_data/artifact_data/v0.0.6/grwl_tindex.gpkg
[12]:
| location | EPSG | geometry | |
|---|---|---|---|
| 0 | GRWL_mask_V01.01//NA17.tif | EPSG:32617 | POLYGON ((-80.92667 4.00635, -77.99333 4.00082... |
| 1 | GRWL_mask_V01.01//NA18.tif | EPSG:32618 | POLYGON ((-78.00811 4.00082, -71.99333 4.00082... |
| 2 | GRWL_mask_V01.01//NA19.tif | EPSG:32619 | POLYGON ((-72.00811 4.00082, -65.99333 4.00082... |
| 3 | GRWL_mask_V01.01//NA20.tif | EPSG:32620 | POLYGON ((-66.00811 4.00082, -59.99333 4.00082... |
| 4 | GRWL_mask_V01.01//NA21.tif | EPSG:32621 | POLYGON ((-60.00811 4.00082, -53.99333 4.00082... |
[13]:
# this returns a DataArray (single variable) wit a mosaic of several files (see source_file attribute)
ds = data_catalog.get_rasterdataset("grwl_mask", bbox=bbox)
ds
2022-10-24 08:06:48,464 - read raster data - data_catalog - INFO - DataCatalog: Getting grwl_mask RasterDataset raster_tindex data from /home/runner/.hydromt_data/artifact_data/v0.0.6/grwl_tindex.gpkg
2022-10-24 08:06:49,696 - read raster data - rasterdataset - DEBUG - RasterDataset: Clip with geom - [11.700, 45.350, 12.950, 46.700]
[13]:
<xarray.DataArray 'grwl_tindex' (y: 5108, x: 3393)>
array([[0, 0, 0, ..., 0, 0, 0],
       [0, 0, 0, ..., 0, 0, 0],
       [0, 0, 0, ..., 0, 0, 0],
       ...,
       [0, 0, 0, ..., 0, 0, 0],
       [0, 0, 0, ..., 0, 0, 0],
       [0, 0, 0, ..., 0, 0, 0]], dtype=uint8)
Coordinates:
  * y            (y) float64 5.177e+06 5.177e+06 ... 5.024e+06 5.024e+06
  * x            (x) float64 2.415e+05 2.415e+05 ... 3.432e+05 3.433e+05
    spatial_ref  int64 1
    mask         (y, x) bool False False False False ... False False False False
Attributes:
    AREA_OR_POINT:       Area
    DataType:            Generic
    RepresentationType:  ATHEMATIC
    _FillValue:          0
    source_file:         NL33.tif; NL32.tif
    paper_doi:           10.1126/science.aat0636
    paper_ref:           Allen and Pavelsky (2018)
    source_license:      CC BY 4.0
    source_url:          https://doi.org/10.5281/zenodo.1297434
    source_version:      1.01