Hydrological Ensemble Verification in the Rhine#
[ ]:
# sphinx_gallery_thumbnail_number = 1

from dpyverification import run_pipeline
import pandas as pd
import numpy as np
import matplotlib.pyplot as plt
[ ]:
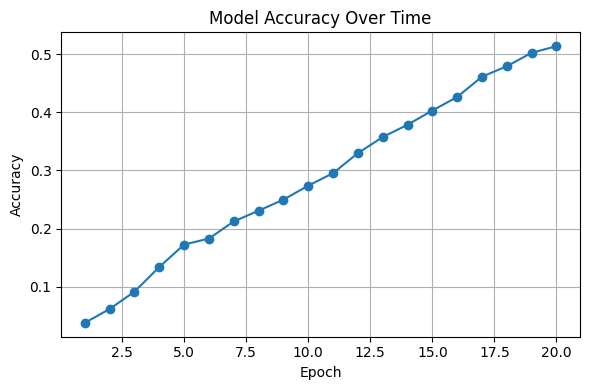
np.random.seed(0)

df = pd.DataFrame(
    {"epoch": range(1, 21), "accuracy": np.clip(np.cumsum(np.random.normal(0.02, 0.01, 20)), 0, 1)}
)

fig, ax = plt.subplots(figsize=(6, 4))
ax.plot(df["epoch"], df["accuracy"], marker="o")
ax.set_title("Model Accuracy Over Time")
ax.set_xlabel("Epoch")
ax.set_ylabel("Accuracy")
ax.grid(True)

plt.tight_layout()
plt.show()