Skip to content

Utilities API

FM2PROF includes a set of utilities to analyse its output.

Compare1D2D

Bases: ModelOutputReader

Utility to compare the results of a 1D and 2D model through visualisation and statistical post-processing.

Note

If 2D and 1D netCDF input files are provided, they will first be converted to csv files. Once csv files are present, the original netCDF files are no longer used. In that case, the arguments to path_1d and path_2d should be None.

Example usage
from fm2prof import Project, utils
project = Project(fr'tests/test_data/compare1d2d/cases/case1/fm2prof.ini')
plotter = utils.Compare1D2D(project=project,
                            start_time=datetime(year=2000, month=1, day=5))

plotter.figure_at_station("NR_919.00")

Parameters

project: `fm2prof.Project` object.
path_1d: path to SOBEK dimr directory
path_2d: path to his nc file
routes: list of branch abbreviations, e.g. ['NR', 'LK']
start_time: start time for plotting and analytics. Use this to crop the time to prevent initalisation from
affecting statistics.
stop_time: stop time for plotting and analytics.
style: `PlotStyles` style

Instantiate a Compare1D2D object.

Source code in fm2prof\utils.py
def __init__(  # noqa: PLR0913
    self,
    project: Project,
    path_1d: Path | str | None = None,
    path_2d: Path | str | None = None,
    routes: list[list[str]] | None = None,
    start_time: None | datetime = None,
    stop_time: None | datetime = None,
    style: str = "sito",
) -> None:
    """Instantiate a Compare1D2D object."""
    if project:
        super().__init__(logger=project.get_logger(), start_time=start_time, stop_time=stop_time)
        self.output_path = project.get_output_directory()
    else:
        super().__init__()

    if isinstance(path_1d, (Path, str)) and Path(path_1d).is_file():
        self.path_flow1d = path_1d
    else:
        self.set_logger_message(
            f"1D netCDF file does not exist or is not provided. Input provided: {path_1d}.",
            "debug",
        )
    if isinstance(path_1d, (Path, str)) and Path(path_2d).is_file():
        self.path_flow2d = path_2d
    else:
        self.set_logger_message(
            f"2D netCDF file does not exist or is not provided. Input provided: {path_2d}.",
            "debug",
        )

    # Defaults
    self.routes = routes
    self.statistics = None
    self._data_1d_h: pd.DataFrame = None
    self._data_2d_h: pd.DataFrame = None
    self._data_1d_h_digitized: pd.DataFrame = None
    self._data_2d_h_digitized: pd.DataFrame = None
    self._qsteps = np.arange(0, 100 * np.ceil(18000 / 100), 200)

    # initiate plotstyle
    self._error_colors = ["#7e3e00", "#FF4433", "#d86a00"]
    self._color_error = self._error_colors[1]
    self._color_scheme = COLORSCHEMES["Koeln"]
    self._plotstyle: str = style
    PlotStyles.apply(style=self._plotstyle)

    # set start time
    self.start_time = start_time
    self.stop_time = stop_time

    self.read_all_data()
    self.digitize_data()

    # create output folder
    output_dirs = [
        "figures/longitudinal",
        "figures/discharge",
        "figures/heatmaps",
        "figures/stations",
    ]
    for od in output_dirs:
        self.output_path.joinpath(od).mkdir(parents=True, exist_ok=True)

colorscheme: str property

Color scheme.

file_1d_h_digitized: Path property

Return 1D water level digitized file path.

file_2d_h_digitized: Path property

Return 2D water level digitized file path.

routes: list[list[str]] property writable

Return routes.

digitize_data()

Compute the average for a given bin for 1D and 2D water level data.

Use to make Q-H graphs instead of T-H graph

Source code in fm2prof\utils.py
def digitize_data(self) -> None:
    """Compute the average for a given bin for 1D and 2D water level data.

    Use to make Q-H graphs instead of T-H graph
    """
    if self.file_1d_h_digitized.is_file():
        self.set_logger_message("Using existing digitized file for 1d")
        self._data_1d_h_digitized = pd.read_csv(self.file_1d_h_digitized, index_col=0)
    else:
        self._data_1d_h_digitized = self._digitize_data(self._data_1d_h, self._data_1d_q, self._qsteps)
        self._data_1d_h_digitized.to_csv(self.file_1d_h_digitized)
    if self.file_2d_h_digitized.is_file():
        self.set_logger_message("Using existing digitized file for 2d")
        self._data_2d_h_digitized = pd.read_csv(self.file_2d_h_digitized, index_col=0)
    else:
        self._data_2d_h_digitized = self._digitize_data(self._data_2d_h, self._data_2d_q, self._qsteps)
        self._data_2d_h_digitized.to_csv(self.file_2d_h_digitized)

eval()

Create multiple figures.

Source code in fm2prof\utils.py
def eval(self) -> None:
    """Create multiple figures."""
    for route in tqdm.tqdm(self.routes):
        self.set_logger_message(f"Making figures for route {route}")
        self.figure_longitudinal_rating_curve(route)
        self.figure_longitudinal_time(route)
        self.heatmap_rating_curve(route)
        self.heatmap_time(route)

    self.set_logger_message("Making figures for stations")
    for station in tqdm.tqdm(self.stations(), total=self._data_1d_h.shape[1]):
        self.figure_at_station(station)

figure_at_station(station, func='time', *, savefig=True)

Create a figure with the timeseries at a single observation station.

Parameters:

Name Type Description Default
station str

name of station. use stations method to list all station names

required
func str

use time for a timeseries and qh for rating curve

'time'
savefig bool

if True, saves to png. If False, returned FigureOutput. Defaults to True.

True

Returns:

Type Description
FigureOutput | None

FigureOutput | None: FigureOutput object or None if savefig is set to True.

Source code in fm2prof\utils.py
def figure_at_station(self, station: str, func: str = "time", *, savefig: bool = True) -> FigureOutput | None:
    """Create a figure with the timeseries at a single observation station.

    Args:
        station (str): name of station. use `stations` method to list all station names
        func (str, optional):  use `time` for a timeseries and `qh` for rating curve
        savefig (bool, optional):if True, saves to png. If False, returned FigureOutput. Defaults to True.

    Returns:
        FigureOutput | None: FigureOutput object or None if savefig is set to True.

    """
    fig, ax = plt.subplots(1, figsize=(12, 5))
    error_ax = ax.twinx()

    # q/h view
    match func.lower():
        case "qh":
            ax.plot(
                self._qsteps,
                self._data_2d_h_digitized[station],
                "--",
                linewidth=2,
                label="2D",
            )
            ax.plot(
                self._qsteps,
                self._data_1d_h_digitized[station],
                "-",
                linewidth=2,
                label="1D",
            )
            ax.set_title(f"{station}\nQH-relatie")
            ax.set_title("QH-relatie")
            ax.set_xlabel("Afvoer [m$^3$/s]")
            ax.set_ylabel("Waterstand [m+NAP]")
            error_ax.plot(
                self._qsteps,
                self._data_1d_h_digitized[station] - self._data_2d_h_digitized[station],
                ".",
                color=self._color_error,
            )
        case "time":
            ax.plot(self.data_2d_h[station], "--", linewidth=2, label="2D")
            ax.plot(self.data_1d_h[station], "-", linewidth=2, label="1D")

            ax.set_ylabel("Waterstand [m+NAP]")
            ax.set_title(f"{station}\nTijdreeks")

            error_ax.plot(
                self.data_1d_h[station] - self.data_2d_h[station],
                ".",
                label="1D-2D",
                color=self._color_error,
            )

    # statistics
    stats = self._get_statistics(station)

    stats_labels = [
        f"bias={stats['bias']:.2f} m",
        f"std={stats['std']:.2f} m",
        f"MAE={stats['mae']:.2f} m",
    ]
    stats_handles = [mpatches.Patch(color="white")] * len(stats_labels)

    # Style
    fig, lgd = PlotStyles.apply(
        fig=fig,
        style=self._plotstyle,
        use_legend=True,
        extra_labels=[stats_handles, stats_labels],
    )

    self._style_error_axes(error_ax, ylim=[-1, 1])

    fig.tight_layout()

    if savefig:
        fig.savefig(
            self.output_path.joinpath("figures/stations").joinpath(f"{station}.png"),
            bbox_extra_artists=[lgd],
            bbox_inches="tight",
        )
        plt.close()
        return None

    return FigureOutput(fig=fig, axes=ax, legend=lgd)

figure_compare_discharge_at_stations(stations, title='no_title', *, savefig=True)

Comparea discharge distribution over two stations.

Like Compare1D2D.figure_at_station.

Example usage:

Compare1D2().figure_compare_discharge_at_stations(stations=["WL_869.00", "PK_869.00"])
Figures are saved to [Compare1D2D.output_path]/figures/discharge

Example output:

.. figure:: figures_utils/discharge/example.png

Example output figure
Source code in fm2prof\utils.py
def figure_compare_discharge_at_stations(
    self,
    stations: list[str],
    title: str = "no_title",
    *,
    savefig: bool = True,
) -> FigureOutput | None:
    """Comparea discharge distribution over two stations.

    Like `Compare1D2D.figure_at_station`.

    Example usage:
    ``` py
    Compare1D2().figure_compare_discharge_at_stations(stations=["WL_869.00", "PK_869.00"])
    ```
    Figures are saved to `[Compare1D2D.output_path]/figures/discharge`

    Example output:

    .. figure:: figures_utils/discharge/example.png

        Example output figure

    """
    fig, axs = plt.subplots(2, 1, figsize=(12, 10))

    ax_error = axs[0].twinx()
    ax_error.set_zorder(axs[0].get_zorder() - 1)  # default zorder is 0 for ax1 and ax2

    if len(stations) != 2:  # noqa: PLR2004
        err_msg = "Must define 2 stations"
        raise ValueError(err_msg)

    linestyles_2d = ["-", "--"]
    for j, station in enumerate(stations):
        if station not in self.stations():
            self.set_logger_message(f"{station} not known", "warning")

        # tijdserie
        axs[0].plot(
            self.data_2d_q[station],
            label=f"2D, {station.split('_')[0]}",
            linewidth=2,
            linestyle=linestyles_2d[j],
        )
        axs[0].plot(
            self.data_1d_q[station],
            label=f"1D, {station.split('_')[0]}",
            linewidth=2,
            linestyle="-",
        )

    ax_error.plot(
        self._data_1d_q[station] - self._data_2d_q[station],
        ".",
        color="r",
        markersize=5,
        label="1D-2D",
    )

    # discharge distribution

    q_2d = self.data_2d_q[stations]
    q_1d = self.data_1d_q[stations]
    axs[1].plot(
        q_2d.sum(axis=1),
        (q_2d.iloc[:, 0] / q_2d.sum(axis=1)) * 100,
        linewidth=2,
        linestyle="--",
    )
    axs[1].plot(
        q_1d.sum(axis=1),
        (q_1d.iloc[:, 0] / q_1d.sum(axis=1)) * 100,
        linewidth=2,
        linestyle="-",
    )
    axs[1].plot(
        q_2d.sum(axis=1),
        (q_2d.iloc[:, 1] / q_2d.sum(axis=1)) * 100,
        linewidth=2,
        linestyle="--",
    )
    axs[1].plot(
        q_1d.sum(axis=1),
        (q_1d.iloc[:, 1] / q_1d.sum(axis=1)) * 100,
        linewidth=2,
        linestyle="-",
    )

    # style
    axs[1].set_ylim(0, 100)
    axs[1].set_title("afvoerverdeling")
    axs[1].set_ylabel("percentage t.o.v. totaal")
    axs[1].set_xlabel("afvoer bovenstrooms [m$^3$/s]")
    axs[0].set_ylabel("afvoer [m$^3$/s]")
    axs[0].set_title("tijdserie")

    suptitle = plt.suptitle(title.upper())

    # Style figure
    fig, lgd = PlotStyles.apply(fig=fig, style=self._plotstyle, use_legend=True)
    self._style_error_axes(ax_error, ylim=[-500, 500], ylabel="1D-2D [m$^3$/s]")
    fig.tight_layout()

    if savefig:
        fig.savefig(
            self.output_path.joinpath("figures/discharge").joinpath(f"{title}.png"),
            bbox_extra_artists=[lgd, suptitle],
            bbox_inches="tight",
        )
        plt.close()
    return FigureOutput(fig=fig, axes=axs, legend=lgd)

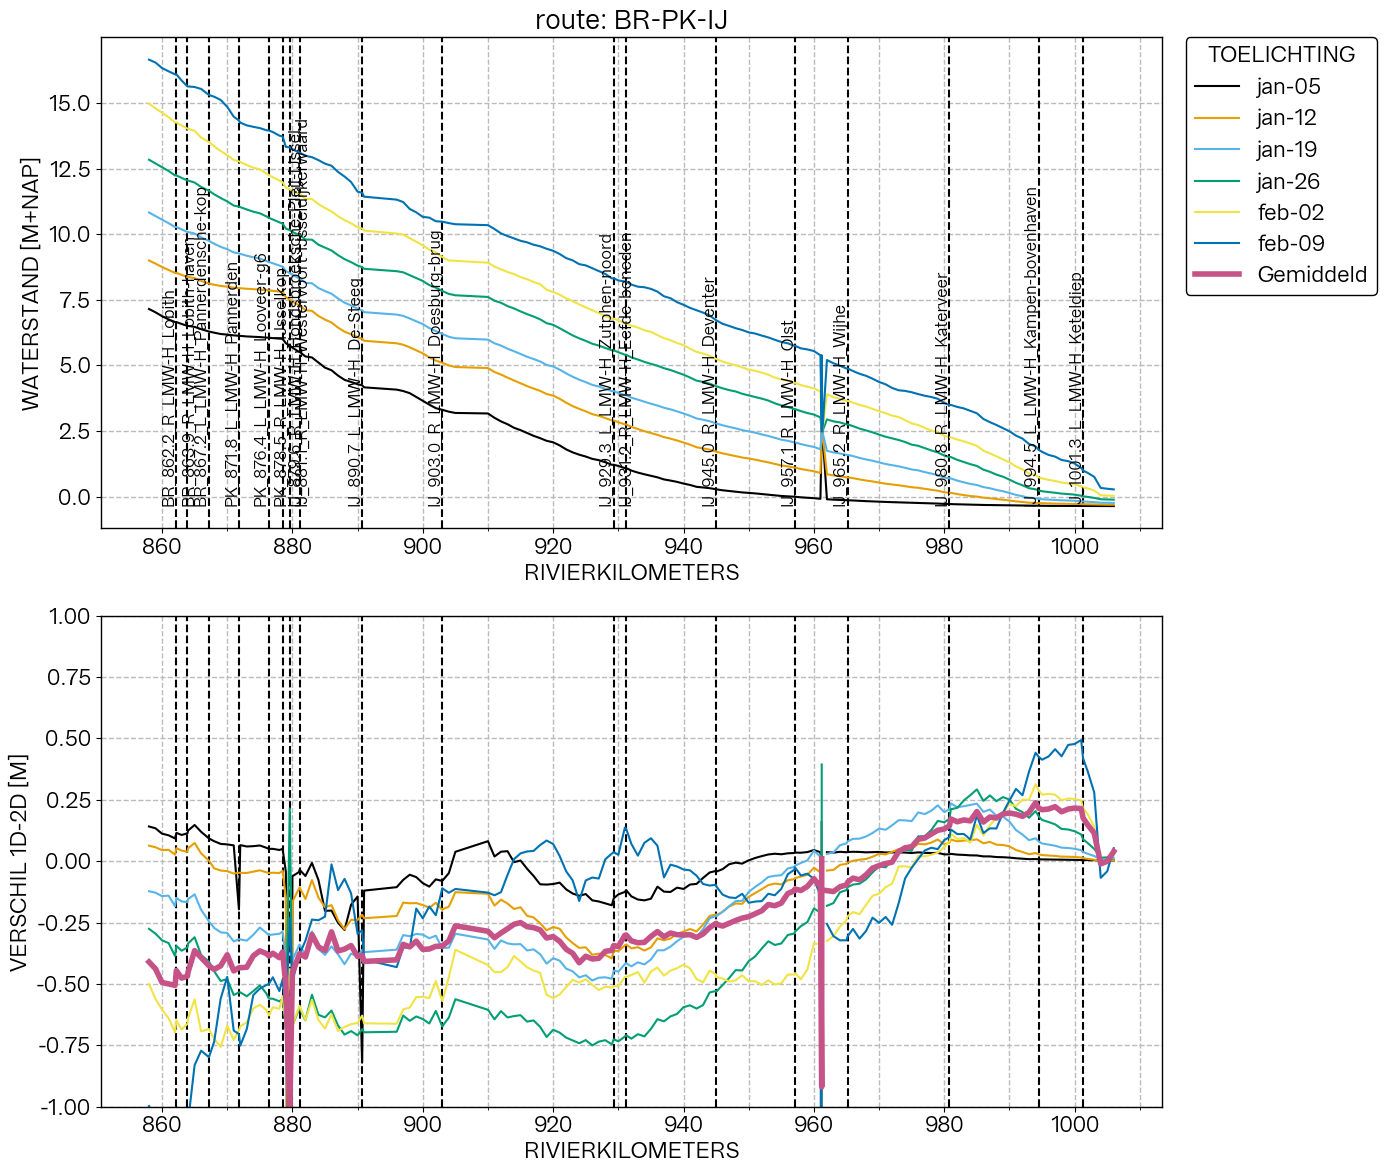
figure_longitudinal(route, stat='time', label='', add_to_fig=None, *, savefig=True)

Create a figure along a route.

Content of figure depends on stat. Figures are saved to [Compare1D2D.output_path]/figures/longitudinal

Example output:

title

Parameters:

Name Type Description Default
route list[str]

List of branches (e.g. ['NK', 'LK'])

required
stat str

What type of longitudinal plot to make (options: "time", "last3", "last25", "max3",

'time'
label str

Label of figure. Defaults to "".

''
add_to_fig FigureOutput | None

if FigureOutput is provided, adds content to figure. Defaults to None.

None
savefig bool

if true, figure is saved to png file. If false, FigureOutput returned, which is input for add_to_fig. Defaults to True.

True

Returns:

Type Description
FigureOutput | None

FigureOutput | None: FigureOutput object or None

Source code in fm2prof\utils.py
def figure_longitudinal(
    self,
    route: list[str],
    stat: str = "time",
    label: str = "",
    add_to_fig: FigureOutput | None = None,
    *,
    savefig: bool = True,
) -> FigureOutput | None:
    """Create a figure along a `route`.

    Content of figure depends on `stat`. Figures are saved to `[Compare1D2D.output_path]/figures/longitudinal`

    Example output:

    ![title](../figures/test_results/compare1d2d/BR-PK-IJ.png)


    Args:
        route (list[str]): List of branches (e.g. ['NK', 'LK'])
        stat (str, optional): What type of longitudinal plot to make (options: "time", "last3", "last25", "max3",
        "max13"). Defaults to "time".
        label (str, optional): Label of figure. Defaults to "".
        add_to_fig (FigureOutput | None, optional):if `FigureOutput` is provided, adds content to figure.
            Defaults to None.
        savefig (bool, optional): if true, figure is saved to png file. If false, `FigureOutput`
                 returned, which is input for `add_to_fig`. Defaults to True.


    Returns:
        FigureOutput | None: FigureOutput object or None

    """
    # Get route and stations along route
    routename = "-".join(route)

    # Make configurable in the future
    labelfunc = self._lmw_func

    # TIME FUNCTION plot line every delta_days days
    match stat:
        case "time":
            lines = self._time_func(route=route)
        case y if y in ["last3", "last25", "max3", "max13"]:
            lines = self._stat_func(stat=y, route=route)
        case _:
            err_msg = f"{stat} is unknown statistics"
            raise KeyError(err_msg)

    # Get figure object
    if add_to_fig is None:
        fig, axs = plt.subplots(2, 1, figsize=(12, 12))
    else:
        fig = add_to_fig.fig
        axs = add_to_fig.axes

    # Filtering which stations to plot
    if add_to_fig is None:
        station_names, station_locs, _ = self.get_route(route)
        st_names, st_locs = labelfunc(station_names, station_locs)
        h1d = self.get_data_along_route(data=self.data_1d_h, route=route)
        for st_name, st_loc in zip(st_names, st_locs):
            for ax in axs:
                ax.axvline(x=st_loc, linestyle="--")

            axs[0].text(
                st_loc,
                h1d.min().min(),
                st_name,
                fontsize=12,
                rotation=90,
                horizontalalignment="left",
                verticalalignment="bottom",
            )

    for line in lines:
        axs[0].plot(line.get("1D"), label=f"{label} {line.get('label')}")

        axs[0].set_ylabel("Waterstand [m+NAP]")
        routestr = "-".join(route)

        axs[0].set_title(f"route: {routestr}")

        axs[1].plot(line.get("1D") - line.get("2D"))
        axs[1].set_ylabel("Verschil 1D-2D [m]")

        for ax in axs:
            ax.set_xlabel("Rivierkilometers")
            ax.xaxis.set_major_locator(MultipleLocator(20))
            ax.xaxis.set_minor_locator(MultipleLocator(10))

    axs[1].set_ylim(-1, 1)
    fig, lgd = PlotStyles.apply(fig=fig, style=self._plotstyle, use_legend=True)

    if savefig:
        plt.tight_layout()
        fig.savefig(
            self.output_path.joinpath(f"figures/longitudinal/{routename}.png"),
            bbox_extra_artists=[lgd],
            bbox_inches="tight",
        )
        plt.close()

    return FigureOutput(fig=fig, axes=axs, legend=lgd)

figure_longitudinal_rating_curve(route)

Create a figure along a route with lines at various dicharges.

To to this, rating curves are generated at each point by digitizing the model output.

Figures are saved to [Compare1D2D.output_path]/figures/longitudinal

Example output:

.. figure:: figures_utils/longitudinal/example_rating_curve.png

example output figure
Source code in fm2prof\utils.py
def figure_longitudinal_rating_curve(self, route: list[str]) -> None:
    """Create a figure along a route with lines at various dicharges.

    To to this, rating curves are generated at each point by digitizing
    the model output.

    Figures are saved to `[Compare1D2D.output_path]/figures/longitudinal`

    Example output:

    .. figure:: figures_utils/longitudinal/example_rating_curve.png

        example output figure

    """
    routename = "-".join(route)
    _, _, lmw_stations = self.get_route(route)

    h1d = self.get_data_along_route(data=self._data_1d_h_digitized, route=route)
    h2d = self.get_data_along_route(data=self._data_2d_h_digitized, route=route)

    discharge_steps = list(self._iter_discharge_steps(h1d.T, n=8))
    if len(discharge_steps) < 1:
        self.set_logger_message("There is too little data to plot a QH relationship", "error")
        return

    # Plot LMW station locations
    fig, axs = plt.subplots(2, 1, figsize=(12, 10))
    prevloc = -9999
    for lmw in lmw_stations:
        if lmw is None:
            continue
        newloc = max(lmw[1], prevloc + 3)
        prevloc = lmw[1]
        for ax in axs:
            ax.axvline(x=lmw[1], linestyle="--", color="#7a8ca0")
        axs[0].text(
            newloc,
            h1d[discharge_steps[0]].min(),
            lmw[0],
            fontsize=12,
            rotation=90,
            horizontalalignment="right",
            verticalalignment="bottom",
        )

    # Plot betrekkingslijnen
    for discharge in discharge_steps:
        axs[0].plot(h1d[discharge], label=f"{discharge:.0f} m$^3$/s")
        axs[0].set_ylabel("waterstand [m+nap]")
        routestr = "-".join(route)

        axs[0].set_title(f"Betrekkingslijnen\n{routestr}")

        axs[1].plot(h1d[discharge] - h2d[discharge])
        axs[1].set_ylabel("Verschil 1D-2D [m]")

        for ax in axs:
            ax.set_xlabel("rivierkilometers")
            ax.xaxis.set_major_locator(MultipleLocator(20))
            ax.xaxis.set_minor_locator(MultipleLocator(10))

    # style figure
    axs[1].set_ylim(-1, 1)
    fig, lgd = PlotStyles.apply(fig, style=self._plotstyle, use_legend=True)
    plt.tight_layout()
    fig.savefig(
        self.output_path.joinpath(
            f"figures/longitudinal/{routename}_rating_curve.png",
        ),
        bbox_extra_artists=[lgd],
        bbox_inches="tight",
    )
    plt.close()

figure_longitudinal_time(route)

Create a figure along a route.

Source code in fm2prof\utils.py
def figure_longitudinal_time(self, route: list[str]) -> None:
    """Create a figure along a `route`."""
    warnings.warn(  # noqa: B028
        'Method figure_longitudinal_time will be removed in the future. Use figure_longitudinal(route, stat="time")'
        "instead",
        category=DeprecationWarning,
    )

    self.figure_longitudinal(route, stat="time")

get_data_along_route(data, route)

Get data along route.

Parameters:

Name Type Description Default
data DataFrame

DataFrame with data

required
route list[str]

list with route data

required

Returns:

Type Description
DataFrame

pd.DataFrame: data

Source code in fm2prof\utils.py
def get_data_along_route(self, data: pd.DataFrame, route: list[str]) -> pd.DataFrame:
    """Get data along route.

    Args:
        data (pd.DataFrame): DataFrame with data
        route (list[str]): list with route data

    Returns:
        pd.DataFrame: data

    """
    stations, rkms, _ = self.get_route(route)

    tmp_data = []
    tmp_data = [data[station] for station in stations]

    route_data_df = pd.DataFrame(index=rkms, data=tmp_data)

    # drop duplicates
    return route_data_df.drop_duplicates()

get_data_along_route_for_time(data, route, time_index)

Get data along route for a given time index.

Parameters:

Name Type Description Default
data DataFrame

Dataframe with data

required
route list[str]

list of route

required
time_index int

time index

required

Returns:

Type Description
Series

pd.Series: Series containing route data

Source code in fm2prof\utils.py
def get_data_along_route_for_time(self, data: pd.DataFrame, route: list[str], time_index: int) -> pd.Series:
    """Get data along route for a given time index.

    Args:
        data (pd.DataFrame): Dataframe with data
        route (list[str]): list of route
        time_index (int): time index

    Returns:
        pd.Series: Series containing route data

    """
    stations, rkms, _ = self.get_route(route)

    tmp_data = []
    tmp_data = [data[station].iloc[time_index] for station in stations]
    return pd.Series(index=rkms, data=tmp_data)

get_route(route)

Return a sorted list of stations along a route, with rkms.

Source code in fm2prof\utils.py
def get_route(self, route: list[str]) -> tuple[list[str], list[float], list[tuple[str, float]]]:
    """Return a sorted list of stations along a route, with rkms."""
    station_names = self._data_2d_h.columns

    # Parse names
    rkms = self._names_to_rkms(station_names)
    branches = self._names_to_branches(station_names)

    # select along route
    routekms = []
    stations = []
    lmw_stations = []

    for stop in route:
        indices = [i for i, b in enumerate(branches) if b == stop]
        routekms.extend([rkms[i] for i in indices])
        stations.extend([station_names[i] for i in indices])
        lmw_stations.extend([(station_names[i], rkms[i]) for i in indices if "LMW" in station_names[i]])

    # sort data
    sorted_indices = np.argsort(routekms)
    sorted_stations = [stations[i] for i in sorted_indices if routekms[i] is not np.nan]
    sorted_rkms = [routekms[i] for i in sorted_indices if routekms[i] is not np.nan]

    # sort lmw stations
    lmw_stations = [lmw_stations[j] for j in np.argsort([i[1] for i in lmw_stations])]
    return sorted_stations, sorted_rkms, lmw_stations

heatmap_rating_curve(route)

Create a 2D heatmap along a route.

The horizontal axis uses the digitized rating curves to match the two models

Figures are saved to [Compare1D2D.output_path]/figures/heatmap

Example output:

.. figure:: figures_utils/heatmaps/example_rating_curve.png

example output figure
Source code in fm2prof\utils.py
def heatmap_rating_curve(self, route: list[str]) -> None:
    """Create a 2D heatmap along a route.

    The horizontal axis uses the digitized rating curves to match the two models

    Figures are saved to `[Compare1D2D.output_path]/figures/heatmap`

    Example output:

    .. figure:: figures_utils/heatmaps/example_rating_curve.png

        example output figure

    """
    routename = "-".join(route)
    _, _, lmw_stations = self.get_route(route)
    data = self._data_1d_h_digitized - self._data_2d_h_digitized

    routedata = self.get_data_along_route(data.dropna(how="all"), route)

    fig, ax = plt.subplots(1, figsize=(12, 7))
    im = ax.pcolormesh(
        routedata.columns,
        routedata.index,
        routedata,
        cmap="Spectral_r",
        vmin=-1,
        vmax=1,
    )
    for lmw in lmw_stations:
        if lmw is None:
            continue
        ax.plot(routedata.columns, [lmw[1]] * len(routedata.columns), "--k", linewidth=1)
        ax.text(routedata.columns[0], lmw[1], lmw[0], fontsize=12)

    ax.set_ylabel("rivierkilometer")
    ax.set_title(f"{routename}\nheatmap Verschillen in waterstand 1D-2D")

    cb = fig.colorbar(im, ax=ax)
    cb.set_label("waterstandsverschil [m+nap]".upper(), rotation=270, labelpad=15)
    PlotStyles.apply(fig, style=self._plotstyle, use_legend=False)
    fig.tight_layout()
    fig.savefig(self.output_path.joinpath(f"figures/heatmaps/{routename}_rating_curve.png"))
    plt.close()

heatmap_time(route)

Create a 2D heatmap along a route.

The horizontal axis uses timemarks to match the 1D and 2D models

Figures are saved to [Compare1D2D.output_path]/figures/heatmap

Example output:

.. figure:: figures_utils/heatmaps/example_time_series.png

example output figure
Source code in fm2prof\utils.py
def heatmap_time(self, route: list[str]) -> None:
    """Create a 2D heatmap along a route.

    The horizontal axis uses timemarks to match the 1D and 2D models

    Figures are saved to `[Compare1D2D.output_path]/figures/heatmap`

    Example output:

    .. figure:: figures_utils/heatmaps/example_time_series.png

        example output figure

    """
    routename = "-".join(route)
    _, _, lmw_stations = self.get_route(route)
    data = self._data_1d_h - self._data_2d_h
    routedata = self.get_data_along_route(data.dropna(how="all"), route)

    fig, ax = plt.subplots(1, figsize=(12, 7))
    im = ax.pcolormesh(
        routedata.columns,
        routedata.index,
        routedata,
        cmap="Spectral_r",
        vmin=-1,
        vmax=1,
    )
    for lmw in lmw_stations:
        if lmw is None:
            continue
        ax.plot(routedata.columns, [lmw[1]] * len(routedata.columns), "--k", linewidth=1)
        ax.text(routedata.columns[0], lmw[1], lmw[0], fontsize=12)

    ax.set_ylabel("rivierkilometer")
    ax.set_title(f"{routename}\nheatmap Verschillen in waterstand 1D-2D")

    cb = fig.colorbar(im, ax=ax)
    cb.set_label("waterstandsverschil [m+nap]".upper(), rotation=270, labelpad=15)
    PlotStyles.apply(fig, style=self._plotstyle, use_legend=False)
    fig.tight_layout()
    fig.savefig(self.output_path.joinpath(f"figures/heatmaps/{routename}_timeseries.png"))
    plt.close()

stations()

Yield station names.

Source code in fm2prof\utils.py
def stations(self) -> Generator[str, None, None]:
    """Yield station names."""
    yield from self._data_1d_h.columns

statistics_to_file(file_path='error_statistics')

Calculate statistics and write them to file.

The output file is a comma-seperated file with the following columns:

,bias,rkm,branch,is_lmw,std,mae,max13,last25

with for each station:

  • bias = bias, mean error
  • rkm = river kilometer of the station
  • branch = name of 1D branch on which the station lies
  • is_lmw = if "LMW" is in the name of station, True.
  • std = standard deviation of the rror
  • mae = mean absolute error of the error
Source code in fm2prof\utils.py
def statistics_to_file(self, file_path: str = "error_statistics") -> None:
    """Calculate statistics and write them to file.

    The output file is a comma-seperated file with the following columns:

    ,bias,rkm,branch,is_lmw,std,mae,max13,last25

    with for each station:

    - bias = bias, mean error
    - rkm = river kilometer of the station
    - branch = name of 1D branch on which the station lies
    - is_lmw = if "LMW" is in the name of station, True.
    - std = standard deviation of the rror
    - mae = mean absolute error of the error

    """
    self.statistics = self._compute_statistics()

    statfile = self.output_path.joinpath(file_path).with_suffix(".csv")
    sumfile = self.output_path.joinpath(file_path + "_summary").with_suffix(".csv")

    # all statistics
    self.statistics.to_csv(statfile)
    self.set_logger_message(f"statistics written to {statfile}")

    # summary of statistics
    s = self.statistics
    with sumfile.open("w") as f:
        for branch in s.branch.unique():
            bbias = s.bias[s.branch == branch].mean()
            bstd = s["std"][s.branch == branch].mean()
            lmw_bias = s.bias[(s.branch == branch) & s.is_lmw].mean()
            lmw_std = s["std"][(s.branch == branch) & s.is_lmw].mean()
            f.write(f"{branch},{bbias:.2f}±({bstd:.2f}), {lmw_bias:.2f}±({lmw_std:.2f})\n")